
Private secondary education has the largest number of establishments for the sector
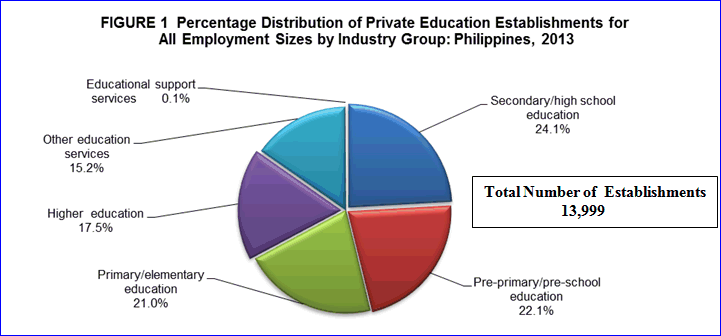
Final results of the 2013 Annual Survey of Philippine Business and Industry covered a total of 13,999 establishments engaged in Private education activities. Of the total, 10,434 (74.5%) had a total employment (TE) of less than 20, and the rest were establishments with total employment of 20 and over which is 3,565 or 25.5 percent.
Among industry groups, secondary/high school education garnered the highest number of establishments at 3,375 or 24.1 percent of the total. This was followed by pre-primary/pre-school education with a total of 3,088 (22.1%). Educational support services industry had the least number of establishments with 16 or 0.1 percent. Figure 1 shows the percentage distribution of education activities establishments by industry group of the sector in 2013.
Higher education establishments garner the highest number of workers
Employment for the sector reached a total of 362,664. Out of this total, 255,342 or 70.4 percent accounted for by establishments with TE of 20 and over while the remaining 107,322 or 29.6 percent were for establishments with TE of less than 20.
Among industries, higher education had the most number of employees with 166,070 or 45.8 percent of the total. Secondary/high school education and primary/elementary education followed with employees of 96,262 (26.5%) and 44,832 (12.4%), respectively. Educational support services activities had the least number of employees with 270 or 0.1 percent. Figure 2 shows the distribution of employment for education activities by industry group in 2013.
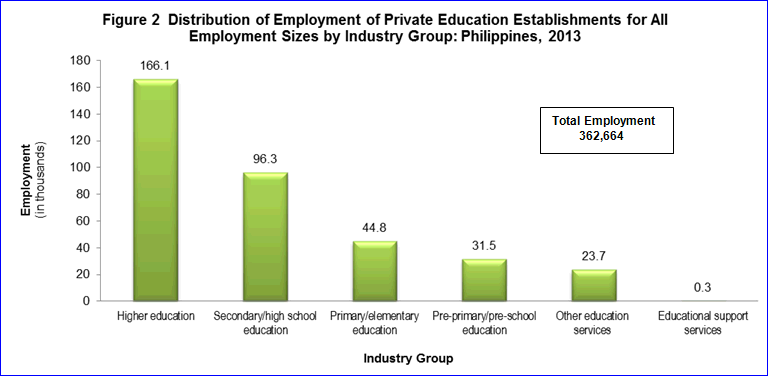
The sector recorded an average number of 26 workers per establishment. Higher education posted the highest average of 68 employees, followed by secondary/high school education with an average of 29 workers. Pre-primary/pre-school education, however, ranked last with only 10 employees per establishment.
Educational support services employees receive the highest average annual compensation
Total compensation paid by the sector amounted to PHP73.3 billion, translating to an average annual compensation of PHP212.7 thousand per paid worker.
Across industry group, educational support service activities paid the highest average annual compensation with PHP488.8 thousand per paid employee, followed by higher education with PHP273.0 thousand. On the other hand, pre-primary/pre-school education activities had the lowest average annual pay of PHP124.2 thousand per employee. Figure 3 shows the average annual compensation per paid employee for private education activities by industry group.

Total income reaches PHP174.0 billion; higher education services are highest earners
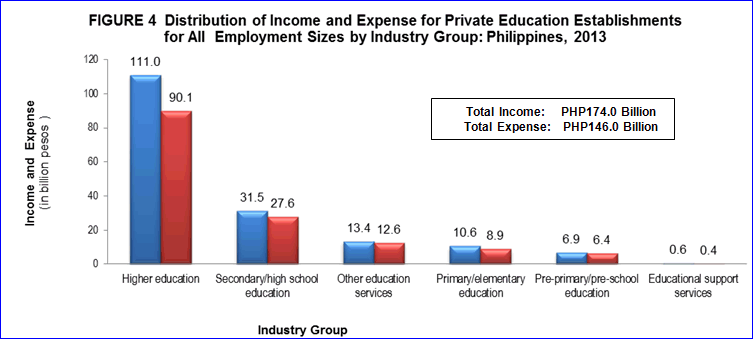
Income generated by the sector reach PHP174.0 billion. Higher education contributed the biggest share with PHP111.0 billion or 63.8 percent of the total income. Second biggest income generating industry was secondary/high school education with PHP31.5 billion or 18.1 percent. Educational support services activities had the least income among the industry group at PHP559.7 million or 0.3 percent.
Total expense reached PHP120.6 billion; higher education is highest spender
Total expense amounts to PHP146.0 billion; higher education spends the largest
Income per peso expense stands at 1.2
The income generated per peso expense stood at 1.2. Among industries, primary/elementary education, higher education and educational support services recorded the highest with 1.2. All other industries of the sector had PHP1.1 income per peso expense.
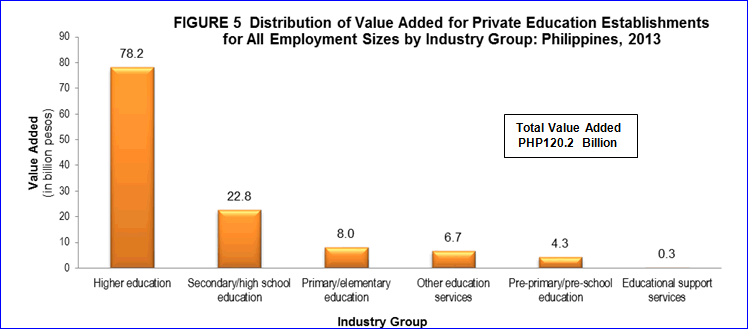
Value added amounts to PHP120.2 billion
Value added for the sector was estimated at PHP120.2 billion. Higher education contributed the highest value added of PHP78.2 billion or 65.0 percent of the total value added. Secondary/high school education and primary/elementary education followed, with PHP22.8 billion (19.0%) and PHP8.0 billion (6.7%) respectively. On the other hand, educational support services reported the lowest with PHP0.3 million (0.2%). Figure 5 shows the distribution of value added of private education activities by industry group.
Employees of higher education services are the most productive
Value added per total employment, a measure of labor productivity, was valued at PHP331.5 thousand per employee. Educational support services had the highest labor productivity of PHP1071.0 thousand among industries. Primary/elementary education workers were the least productive with PHP135.9 thousand per total employment.
Gross additions to tangible fixed assets totals PHP16.7 billion
The sector acquired a total of PHP16.7 billion worth of fixed assets in 2013. Higher education industry recorded the highest among the industry groups with PHP11.2 billion or 67.1 percent of the total, followed by other education services activities with PHP3.1 billion or 18.4 percent. Educational support services activities had the least gross addition to fixed assets with PHP13.4 million.
Other education services records the highest change in inventories of PHP5.3 million
The Change in inventories is defined as the value of ending less the beginning inventory. Three industry groups posted positive change in inventories are the following:.
- Other education services, PHP5.3 million
- Pre-primary/pre-school education, PHP710 thousand
- Secondary/high school education, PHP119 thousand
Subsidies reach to PHP1.2 billion
Subsidies in 2013 reached PHP1.2 billion with the government providing grants to the industries of the sector except for educational support services. Higher education received the highest grant amounting to PHP576.3 million (48.1%), followed by secondary/high school education and primary/elementary education with PHP489.2 million or 40.9 percent and PHP118.6 million or 9.9 percent, respectively. Other education services activities received the smallest portion of the grants amounting to PHP4.2 million (0.4%).
Sales from E-commerce amounts to PHP396.0 million
Transactions from e-commerce reached PHP396.0 million in 2013. Other education services activity is the only industry with reported sales from e-commerce.
TECHNICAL NOTES
Introduction
This Special Release presents the final results of the 2013 Annual Survey of Philippine Business and Industry (ASPBI) for the Private Education Activities sector for all employment sizes in the formal sector of the economy.
The 2013 ASPBI is one of the designated statistical activities of the former National Statistics Office (NSO) now Philippine Statistics Authority (PSA). Data collected from the survey will provide information on the levels, structure, performance and trends of economic activities of the formal sector of the economy for the reference period 2013. It will also serve as benchmark information in the measurement and comparison of national and regional economic growth.
To provide establishment respondents ease of accomplishing the 2013 ASPBI questionnaires, the income and expense account in the Financial Statement of establishment was adopted in the design of sectoral 2013 ASPBI questionnaires. Income and revenue have the same concept in recording financial transaction of establishments while expense is cost incurred on a consumed basis.
Data collection was intensified through the use of web-based or online accomplishment of questionnaire through the PSA website and downloading of e-questionnaire and submission thru e-mail.
Legal Authority
The conduct of the ASPBI is governed by authority of the following legislative acts and presidential directives:
- Republic Act 10625 know as the Philippine Statistical Act of 2013 dated September 12, 2013 - (Reorganizing and strengthening of the Philippine Statistical System (PSS), its agencies and instrumentalities). It shall be the policy of the State to effect the necessary and proper changes in the organizational and functional structures of the PSS in order to rationalize and promote efficiency and effectiveness in the delivery of statistical services.
Section 27 of Republic Act No 10625 states that:
"... Respondents of primary data collection activities such as censuses and sample surveys are obliged to give truthful and complete answers to statistical inquiries. The gathering, consolidation and analysis of such data shall likewise be done in the most truthful and credible manner. Any violation of this Act shall result in the imposition of the penalty of one (1) yearimprisonment and a fine of One hundred thousand pesos (P100,000.00). In cases where the respondent fails to give truthfulcomplete answers to such statistical inquiries is a corporation, the above penalty shall be imposed against, such corporation, enterprise or business concerned, shall be imposed a fine ranging from One hundred thousand pesos (P100,000.00) to Five hundred thousand pesos (P500,000.00)..."
Confidenciality of Information
- Republic Act 10625 (Philippine Statistical Act of 2013)
Section 27 of RA 10625 states that:
"... Any person, including parties within the PSA Board and the PSA, who breach the confidentiality of information, whether by carelessness, improper behavior, behavior with malicious intent, and use of confidential information for profit, are considered guilty of an offense and shall be liable to fines as prescribed by the PSA Board which shall not be less than Five thousend pesos (P5,000.00) nor more than Ten thousand pesos (P10,000,00.00) and/or imprisonment of three (3) months but not exceed one (1) year,
- Republic Act 6713 (Code of Conduct and Ethical Standards for Public Officials and employees dated February 20, 1989)
Section 7 of RA 6713 states that:
"... (c) Disclosure and/or misuse of confidential informatiom. Public officials and employees shall not use or divulge confidential or classified information officially known to them by reason of their office and not made available to the public, either: (1) to further their private interest, or give undue advantage of anyone, or (2) to prejudice the public interest..."
Scope and Coverage
The 2013 ASPBI was a nationwide undertaking confined to the formal sector of the economy and as such excluded the informal sector. The following comprise the formal sector:
- Corporations and partnerships
- Cooperatives and foundations
- Single establishment with employment of 10 or more
- Single proprietorship with branches
Hence, the 2013 ASPBI covered only the following economic units:
- All establishments with total employment (TE) of 10 or more, and;
- All establishments with TE of less than 10, except those establishments with Legal Organization = 1 (single proprietorship) and Economic Organization = 1 (single establishment), that are engaged in economic activities classified according to the 2009 Philippine Standard Industrial Classification (PSIC).
The initial estimate of the 2013 List of Establishments (LE), the frame used to draw the sample establishments for the 2013 ASPBI, registered a total of 941,000 establishments in operation in the country for the year. About 263,000 establishments (28% of total establishments) belong to the "Formal Sector" of which 229,000 (87%) comprise the establishment frame.
Listed below are the 18 economic sectors within the scope of the 2013 ASPBI classified under the 2009 PSIC.
- Agriculture, Forestry and Fishing (A)
- Mining and Quarrying (B)
- Manufacturing (C)
- Electricity, Gas, Steam, and Air Conditioning Supply (D)
- Water Supply; Sewerage, Waste Management and Remediation Activities (E)
- Construction (F)
- Wholesale and Retail Trade; Repair and Maintenance of Motor Vehicles, Motorcycles (G)
- Transportation and Storage (H)
- Accommodation and Food service activities (I)
- Information and Communication (J)
- Financial and Insurance Activities (K)
- Real Estate Activities (L)
- Professional, Scientific and Technical Activities (M)
- Administrative and Support Service Activities (N)
- Education (P)
- Human Health and Social Activities (Q)
- Arts, Entertainment and Recreation (R)
- Other Service Activities (S)
Sampling Design
The unit of enumeration for the 2013 ASPBI was the establishment. An establishment is defined as an economic unit, which engages, under a single ownership or control, in one or predominantly one kind of activity at a single fixed physical location.
Classification of Establishments
An establishment is categorized by its economic organization (EO), legal organization (LO), industrial classification, employment size and geographic location.
Economic organizations (EO). This refers to the organizational structure or role of the establishment in the organization. The following are the types of economic organization:
- Single establishment (EO=1) is an establishment which has neither branch nor main office. It may have ancillary unit/s, other than main office, located elsewhere.
- Branch only (EO=2) is an establishment which has a separate main office located elsewhere.
- Establishment and Main Office (EO=3) is one where the establishment is located in the same address as the main office and with branch/es elsewhere.
- Main Office (EO=4) is a unit which controls, supervises and directs one or more establishments of an enterprise.
- Ancillary Unit other than Main Office (EO=5) is a unit that operates primarily or exclusively for a related establishment or group of related establishments or its parent establishment and provides services that support those establishments.
Legal Organization (LO). (EO). This refers to the legal form of the economic entity provides the legal basis for ownership of the establishment. The following are the types of legal organization:
- Single Proprietorship (LO=1) refers to a business establishment organized, owned, and managed by one person, who alone assumes the risk of the business enterprise. A sole proprietorship must apply for a business name and be registered with the Department of Trade and Industry (DTI).
- Partnership (LO=2) refers to an association of two or more individuals for the conduct of a business enterprise based upon an agreement or contract between or among them to contribute money, property or industry into a common fund with the intention of dividing profits among themselves.
- Government Corporation (LO=3) also called Government-Owned or Controlled Corporation (GOCC) refers to a corporation organized for private aim, benefit or purpose with the government as the major stockholder, regardless of whether they are stock or non-stock corporations.
- Main Office (EO=4) is a unit which controls, supervises and directs one or more establishments of an enterprise.
- Stock Corporation (LO=4) refers to an ordinary business corporation organized by private persons, created and operated for the purpose of making a profit which may be distributed in the form of dividends to stockholders on the basis of their invested capital.
- Non Stock, Non-profit Corporation (LO=5) refers to a business corporation which does not issue stock to its members and are created not to profit but for the public good and welfare. Of this character are most of the religious, social, charitable, educational, literary scientific, civic and political organizations and societies.
- Cooperative (LO=6) refers to an organization composed primarily of small producers and/or consumers who voluntarily join together to form a business enterprise which they themselves own, control and patronize.
- Others (LO=7) refer to an organization not classified in any of the above classification. It includes private associations, foundations, Non-Governmental Organizations, or other forms of legal organizations.
Industrial classification The Industrial Classification of an economic unit is determined by the activity from which it derives its major income or revenue. The 2009 PSIC which was approved for adoption by government agencies and instrumentalities through NSCB Resolution No. 2 Series 2010 was utilized to classify economic units according to their economic activities.
Size (SZ) of the Unit of Enumeration The size of an economic unit is determined by its total employment (TE) as of specific date. Total employment (TE) refers to the total number of persons who work in or for the establishment/enterprise. This includes paid employees, working owners, unpaid workers and all employees who work full-time or part-time including seasonal workers. Included also are persons on short term leave such as those on sick, vacation or annual leaves and on strike.
The following are the size codes and corresponding total employment used in the 2013 ASPBI:
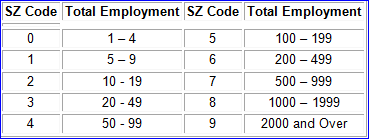
Geographic Classification Establishments are also classified by geographic area using the Philippine Standard Geographic Code (PSGC) classification. The PSGC contains the latest updates on the official number of regions, provinces, cities, municipalities, and barangays in the Philippines. The latest PSGC as of December 31, 2013 was used for the 2013 ASPBI.
Sampling Design
Selection of sample establishment for the 2013 ASPBI was done using stratified systematic sampling with 3-digit or 5-digit PSIC serving as industry strata and employment size as the second stratification variable.
Estimation Procedure
For Establishments with TE of Less Than 20
a. Non-Certainty Stratum
The estimate of the total of a characteristic  for the non-certainty employment stratum TE less than 20 in the sth industry domain was
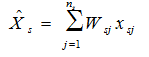
where:
- s = denotes the non-certainty employment strata in TE of less than 20
- Xsj = value of the jth establishment in non-certainty employment stratum in TE of less than 20 in Sth industry domain
- j = 1,2,3..., ns establishments
- Wsj = weight of the jth establishment in the non-certainty employment stratum of less than 20 in the sth industry domain

- Ns = total number of establishments in the non-certainty employment stratum in TE of less than 20 in the sth industry domain
- ns = number of sample establishments in the non-certainty employment stratum in TE of less than 20 in sth domain
b. Certainty Stratum
The total of a characteristic  for the certainty employment stratum in the Cth industry domain was
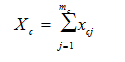
where:
- c = denotes the certainty employment strata in TE of less than 20 in the cth industry
- xcj = value of the jth establishment in the certainty employment strata in TE of less than 20 in the cth industry domain
- j = 1,2,3,..., mc establishments
- mc = number of establishments in the certainty employment strata in TE of less than 20 in the cth industry domain
c. Total Estimate for TE of Less Than 20
For all sections except B and C, national level estimates of the total of a characteristic  for the industry domain was obtain by aggregating the estimates for all employment strata (non-certainty and certainty) in the same industry domain,
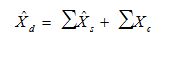
where d denotes the industry domain.
For Establishments with TE of 20 and Over
a. Non-Certainty Stratum (strata of TE 20 to 49 and TE 50 to 99 for Sections G, H, I, J, K, L, M, N, P, Q, R and S.
The estimate of the total of a characteristic ![]() for the non-certainty employment strata in TE of 20 and over for selected industry domain in each region was as
for the non-certainty employment strata in TE of 20 and over for selected industry domain in each region was as
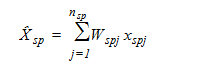
where:
- s = denotes the non-certainty employment strata in TE 20 and over
- p = 1,2,...,17 regions geographic domains
- xspj = value of the jth establishment in the certainty employment strata in TE of 20 and over for an industry domain in each region
- j = 1,2,3..., nsp establishments
- Wspj = weight of the jth establishment in the non-certainty employment strata in TE of 20 and over for an industry domain in each region
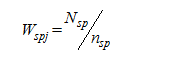
- Nsp = total number of establishments in the non-certainty employment strata in TE of 20 and over for anindustry domain in each region
- nsp = number of sample establishments in the non-certainty employment strata in TE of 20 and over for an industry domain in each region
b. Certainty Stratum
The the total of a characteristic  for the certainty employment stratum in TE of 20 and over in an industry domain in each region was
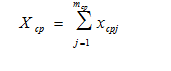
where:
- c = denotes the non-certainty employment strata in TE of 20 and over
- p = 1,2,...17, regions (geographic domains)
- xcpj = value of the jth establishment in the certainty employment strata in TE of 20 and over in an industry domain within each region
- j = 1,2,3..., mcp establishment
- mcp = number of establishments in the certainty strata in TE of 20 and over in anindustry domain in each region
c. Total Estimate for TE of 20 and Over
The estimate of the total of a characteristic  for the industry domain in each (geographic domain) was obtained by aggregating the estimates for all employment strata (non-certainty and certainty) in the same industry
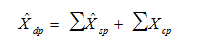
where dp denotes the industry domains in each region.
National level estimates of the characteristics by industry domain were obtained by aggregating separately the estimates (Xdp) for the particular industry domain from all the regions.
Weight Adjustment Factor for Non-Response
To account for non-response in the non-certainty strata, the adjustment factor (n/n’) was multiplied with the sampling weight (W) of each of the sampling unit. The sampling weight, defined as N/n, was recomputed as
Thus, the adjusted weight (W’sj) for employment stratum in TE 1-9 or TE 10-19 was
where:
- Ns = total number of establisments in the employment stratum in TE 1-9 or TE 10-19 in the sth industry domain
- n's = number of responding establishments in the employment stratum in TE 1-9 or TE 10-19 in the sth industry domain
For the non-certainty employment stratum for the selected industry domain with TE 20-99, the adjusted weight (W'spj) was
where:
- Nsp = total number of establisments in the non-certainty employment stratum with TE 20-99 for the selected industry domain within each geographic domain (region)
- n'sp = number of responding establishments in the non-certainty employment stratum with TE 20-99 for the selected industry domain within each geographic domain (region)
Questionaire Design
The questionnaire design is basically the same as that of the 2012 Census of Philippine Business and Industry. However, changes were made in the disaggregation of data items for fixed assets in support to the requirements of the 2008 Systems of National Accounts with respect to the generation of fixed capital formation.
The sample establishments responded also to the survey through the use of Web-based version of the 2013 ASPBI questionnaires which was accomplished online at the PSA website. Likewise, an e-questionnaire was also downloaded and submitted thru e-mail.
Response Rate
Field operations of the 2013 ASPBI were scheduled from September to December 2014.
Total response rate for Education Activities sector was 92.2 percent (1,084 out of 1191 establishments). This include receipts of "good" questionnaires, partially accomplished questionnaires, reports of closed, moved out or out of scope establishments.
Of the total responses, 16 establishments responded online and and none accomplished e-questionnaire. Others convert accomplished questionnaires to portable document format (PDF) and submit through e-mail.
CONCEPTS AND DEFINITIONS OF TERMS
Establishment is an economic unit under a single ownership and control, i.e. under a single entity, engaged in one or predominantly one kind of economic activity at a single fixed location.
Total employment is the number of persons who worked in for the establishment as of November 15, 2013.
Paid employees are all full-time and part-time employees working in or for the establishment and receiving pay, as well as those working away from the establishment and paid by and under the control of the establishment. Included also are all employees on sick or maternity leave, paid vacation or holiday and on strike. Excluded are directors paid solely for their attendance at meetings, consultants, workers on indefinite leave, working owners who do not receive regular pay, home workers and workers receiving pure commissions only.
Unpaid workers are working owners who do not receive regular pay, apprentices and learners without regular pay and persons working for at least 1/3 of the working time normal to the establishment without regular pay. Excluded are silent or inactive business partners.
Compensation is the sum of salaries and wages, separation, terminal pay and gratuities paid by the establishment to its employees and total employer’s contribution to SSS/GSIS, ECC, PhilHealth, Pag-ibig, etc.
Salaries and wages are payments in cash or in kind to all employees, prior to deductions for employee’s contributions to SSS/GSIS, withholding tax, etc. Included are total basic pay, overtime pay and other benefits.
Income or Revenue includes cash received and receivables for goods/products and by-products sold and services rendered. Valuation is at producer prices (ex-establishment) net of discounts and allowances, including duties and taxes but excluding subsidies.
Cost refers to all expenses excluding compensation incurred during the year whether paid or payable. Valuation should be at purchaser price including taxes and other charges, net of discounts, rebates, returns and allowances. Goods received from and services rendered by other establishment of the same enterprise are valued as though purchased.
Expense refers to cost incurred by the establishment during the year whether paid or payable. This is treated on a consumed basis. Valuation is at purchaser price including taxes and other charges, net of rebates, returns and allowances. Goods and services received by the establishment from other establishments of the same enterprise are valued as though purchased.
Intermediate Cost refers to expenses incurred in the production of goods such as materials and supplies purchased, fuels purchased, electricity purchased and industrial services done by others plus beginning inventory of materials, supplies and fuels less ending inventory of materials, supplies and fuels.
Valued added is gross output less intermediate input. Gross output for private education activities is the sum of the total revenue (less interest income, rent income from land, dividend income, royalty income and franchise income), capital expenditures of fixed assets produced on own account and change in inventories. Intermediate input is equal to the sum of the following cost items: materials and supplies purchased; fuels, lubricants, oils and greases purchased; electricity purchased, water purchased; cost of industrial services done by others; cost of non-industrial services done by others; goods purchased for resale; research and development expense; environmental protection expense; royalty fee; franchise fee; payouts and other cost. .
Gross addition to tangible fixed assets is equal to capital expenditures less sale of fixed assets, including land.
Change in inventories is computed as the total of ending inventory less the total beginning inventory.
Inventories refer to the stock of goods owned by and under the control of the establishment as of a fixed date, regardless of where the stocks are located. Valuation is at current replacement cost in purchaser prices. Replacement cost is the cost of an item in terms of its present price rather than its original cost.
Subsidies are special grants in the form of financial assistance or tax exemption or tax privilege given by the government to aid and develop an industry.
E-Commerce refers to the selling of products or services over electronic systems such as the Internet Protocol-based networks and other computer networks, Electronic Data Interchange (EDI) network, or other on-line system.