
Support activities for transportation industry dominates Transport and Storage Sector
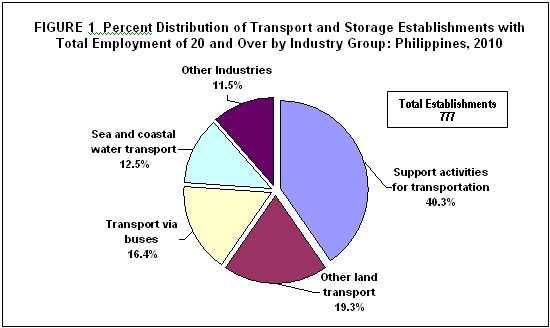
From the preliminary results of the 2010 Annual Survey of Philippine Business and Industry (ASPBI), the Philippines had a total of 777 establishments with Total Employment (TE) of 20 and over engaged in Transport and Storage sector. Support activities for transportation topped the sector with 313 establishments or 40.3 percent, majority of which were engaged in freight forwarding services and service activities incidental to water transportation comprising 25 percent of the total establishments. This was followed by other land transport and transport via buses industries with 150 establishments (19.3%) and 128 establishments (16.4%), respectively. Figure 1 shows the percent distribution of establishments by industry group in 2010.
Most of the establishments are located in National Capital Region (NCR)
On the regional level, more than half of the establishments were located in the NCR with 448 (57.7%). Central Visayas followed with 74 establishments (9.5%) and CALABARZON came in third with 59 establishments (7.6%). Autonomous Region in Muslim Mindanao (ARMM) had the least number of establishments recording only two.
Support activities for transportation industry generates the highest employment
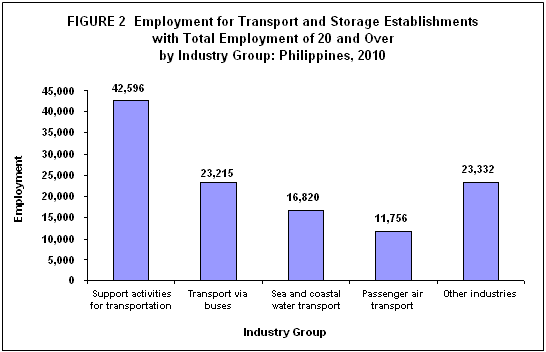
Employment for the sector reached a total of 117,719 in 2010. Almost all or 98.9 percent were paid employees (116,428).
Among industries, support activities for transportation industry had the highest number of employees with 42,596 (36.2%). The transport via buses industry ranked second with 19.7 percent and sea and coastal water transport, third with 14.3 percent. Distribution of employment by industry group for the sector is shown in Figure 2.
Across regions, NCR was the top employer with 70,961 employees (60.3%). Central Visayas was a distant second with 9,615 employees (8.2%) followed by CALABARZON with 6,838 employees (5.8%). Cagayan Valley region employed the least with only 114 employees (0.1%).
Passenger air transport industry pays the highest compensation
The total compensation paid by Transport and Storage sector amounted to PHP30.1 billion, an equivalent of PHP258,645 average annual compensation.
By industry group, PHP9.6 billion (31.9%) of the total compensation of the sector was paid by passenger air transport industry. Support activities for transportation industry came in second with PHP9.6 billion (31.8%) and sea and coastal water transport industry placed third with PHP4.1 billion (13.8%).
Among regions, NCR topped the labor payments that amounted to PHP24.2 billion (80.2%). Central Visayas came next with PHP1.4 billion (4.7%) and Davao region came third with PHP1.0 billion (3.5%). CAR was the least payer with only PHP10.5 million.
Employees of passenger air transport industry earn the highest
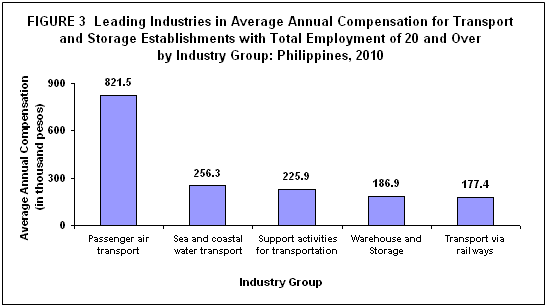
Passenger air transport industry employees were the highest earners in 2010 with an average annual compensation of PHP821,482. Employees of sea and coastal water transport industry and support activities for transportation industry followed with PHP256,259 and PHP225,866, respectively. Workers in other land transport industry received the lowest average annual compensation of PHP120,623. Figure 3 shows the leading industries with highest average annual compensation for the sector.
By region, NCR-based workers received the highest average annual compensation of PHP341,863 while employees from ARMM received the least with only PHP28,571.
Total revenue sums to PHP255.5 billion; passenger air transport industry produces the largest
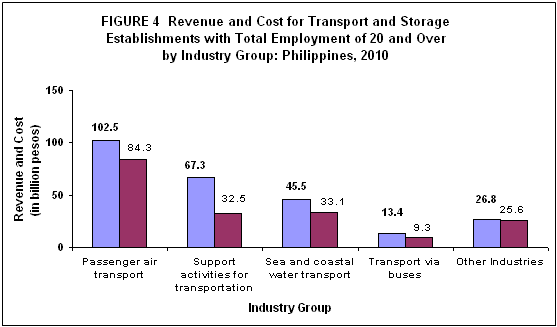
Gross revenue earned in 2010 for Transport and Storage sector reached PHP255.5 billion. Passenger air transport industry was the top contributor with revenue of PHP102.5 billion or 40.1 percent of the total. Earning the second place was support activities for transportation industry with PHP67.3 billion (26.3%) followed by Sea and coastal water transport with PHP45.5 billion (17.8%).
With respect to regions, NCR produced the highest revenue amounting to PhP218.0 billion (85.3%). CAR generated the least revenue amounting to only PhP34.9 million.
Total cost reaches PHP184.8 billion, passenger air transport industry spends the highest
Costs for operating the industry summed up to PHP184.8 billion. Passenger air transport industry incurred the highest cost with PHP84.3 billion (45.6%) followed by sea and coastal water transport industry with PHP33.1 billion (17.9%). Support activities for transportation came in third with PHP32.5 billion (17.6%). Revenue and cost distribution for the sector is shown in Figure 4.
Across regions, NCR spent the largest as it incurred PHP156.4 billion (84.6%) cost for operating the industry. Central Visayas and CALABARZON followed with PHP8.6 billion (4.7%) and PHP6.8 billion (3.7%), respectively. CAR spent the least cost with only PHP24.7 million.
Revenue-cost ratio reaches 1.38, support activities for transportation industry records the highest returns
Revenue per peso cost for the sector amounted to 1.38. Among industries, support activities for transportation industry posted the highest ratio of 2.07, followed by transport via buses and other land transport industries with same ratio of 1.44 revenue per peso cost.
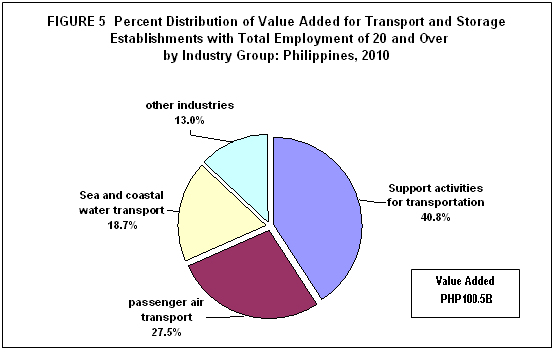
Value added amounts to PHP100.5 billion
Value added was estimated at PHP100.5 billion. A little over forty percent of the total value added of the sector or PHP41 billion was contributed by support activities for transportation. Passenger air transport and sea and coastal water transport industries followed with PHP27.6 billion (27.5%) and PHP18.8 billion (18.7%), respectively. Figure 5 shows the percent distribution of value added for the sector in 2010.
Employees of passenger air transport and Sea and coastal water transport industries are the most productive
Employees of passenger air transport industry were the most productive in 2010 in terms of value added per worker with PHP2.3 million, more than the national average of PHP853.9 thousand. Sea and coastal water transport and support activities for transportation were the other industries that surpassed the national average with PHP1.1 million and PhP962 thousand, respectively.
Revenue per employee, another measure of labor productivity, was estimated at PHP2.1 million. Among industries, passenger air transport industry had the highest average of PHP8.7 million while transport via buses industry recorded the least average of PHP578 thousand.
Gross additions to tangible fixed assets sums to PHP18.9 billion
The Transport and Storage establishments had total gross additions to tangible fixed assets amounted to PHP18.9 billion in 2010. Among industries, passenger air transport industry registered the highest addition to fixed assets with PHP9.1 billion or accounting for 48.2 percent of the total. Establishments engaged in sea and coastal water transport and support activities for transportation industries ranked second and third with PHP5.0 billion (26.3%) and PHP2.0 billion (10.5%), respectively. Other industries registered less than five percent share to total gross addition to fixed assets.
Total change in inventories totals to PhP2.1 billion
Change in inventories, defined as the value of ending inventory less the beginning, amounted to PHP2.1 billion in 2010. Among industries, sea and coastal water transport industry recorded the highest change in inventories with PHP1.3 billion (59.2%). Passenger air transport industry followed with PHP612.2 million (28.3%). Transport via railways industry, on the other hand, had negative change in inventories amounting to PHP155.9 million.
Subsidies in 2010 amounts to PHP5.8 billion
Subsidies granted by the government to the sector amounted to PHP5.8 billion in 2010. Most of the subsidies were given to transport via railways with PHP5.8 billion (99.7%). Sea and coastal water transport industry was a far second with PHP11 million.
TECHNICAL NOTES
Introduction
The 2010 Annual Survey of Philippine Business and Industry (ASPBI), conducted in 2011 with 2010 as reference year, is one of the continuing activities of the National Statistics Office. It will be a source of benchmark levels on the structure and trends of economic activities in the country for the year 2010. Particularly, the data from ASPBI will be used in constructing national and regional income accounts in the country, determining and comparing regional economic structures, and formulating plans and policies of the government in the attainment of economic goals..
The conduct of the ASPBI is governed by legislative acts and presidential directives, specifically Commonwealth Act No. 591 which was approved on August 19,1940..
Scope and coverage
The 2010 ASPBI covered establishments engaged in 18 economic sections classified under the 2009 Philippine Standard Industrial classification (PSIC) namely:
- Agriculture, Forestry and Fishing
- Mining and Quarrying
- Manufacturing
- Electricity, Gas, Steam and Air Conditioning Supply
- Water Supply, Sewerage, Waste Management and Remediation Activities
- Construction
- Wholesale and Retail Trade; Repair of Motor Vehicles and Motorcycles
- Transportation and Storage
- Accommodation and Food Service Activities
- Information and Communication
- Financial and Insurance Activities
- Real Estate Activities
- Professional, Scientific and Technical Services
- Administrative and Support Service Activities
- Education
- Human Health and Social Work Activities
- Arts, Entertainment and Recreation
- Other Service Activities
The scope of the ASPBI was confined to “formal sector” only, which consists of the following:
- Corporations and partnership
- Cooperatives and foundations
- Single proprietorships with employment of 10 or more
- Single proprietorships with branches
Like all other establishment surveys conducted by the NSO, the 2010 ASPBI used establishment as the unit of enumeration. It is defined as “an economic unit under a single ownership or control, i.e. under a single legal entity, engaged in one or predominantly one kind of economic activity at a single fixed location.”.
Classification of Establishments
Before the actual selection of samples, the establishments listed in the frame were classified based on economic organization (EO), legal organization (LO), industrial classification, employment size, and geographic location.
Economic organizations relates to the organizational structure or role of the establishment in the organization. The following are the types of economic organization:
- Single establishment is an establishment which has neither branch nor main office
- Branch only is an establishment which has a separate main office located elsewhere
- Establishment and main office, both located in the same address and with branches elsewhere
- Main office only is the unit which controls, supervises and directs one or more establishments of an enterprise
- Ancillary unit other than main office is the unit that operates primarily or exclusively for a related establishment or group of related establishments or its parent establishment and provides goods or services that support but do not become part of the output of those establishments
The legal organization provides the legal basis for ownership of the establishment. The following are the types of legal organization:
- Single Proprietorship refers to a business establishment organized, owned, and managed by one person, who alone assumes the risk of the business enterprise. The establishment name is that of a person, or it has words such as Owner, Proprietor or Operator
- Partnership refers to an association of two or more individuals for the conduct of a business enterprise based upon an agreement or contract between or among them to contribute money, property or industry into a common fund with the intention of dividing profits among themselves. The establishment name includes words such as Owners , Partners, Limited or LTD., Associates or ASSOCS
- Government Corporation is a private corporation organized for private aim, benefit or purpose and owned and controlled by the government. The establishment name included words such as Corporation or CORP., INCORPORATED or INC
- Stock Corporation is an ordinary business corporation organized by private persons, created and operated for the purpose of making a profit which may be distributed in the form of dividends to stockholders on the basis of their invested capital. The establishment’s name includes words such Corporation or Corp, Incorporated or INC
- Non-Stock, Non-Profit Corporation is a business corporation which does not issue stocks to its members and is created not to profit but for the public good and welfare. Of this character are most of the religious, social, charitable, educational, literary, scientific, civic and political organizations and societies. The establishment’s name includes words such as Corporation or Corp., Incorporated or Inc.
- Cooperative is an organization composed primarily of small producers/consumers who voluntarily join together to form a business enterprise, which they themselves own, control and patronize. The establishment’s name includes words such as Cooperative or COOP
- Others are organizations not classified in any of the above classification. It includes private associations, foundations, Non-Governmental Organization, or other forms of legal organizations.
The industrial classification of an economic unit is determined by the activity from which it derives its major income or revenue. The amended 1994 PSIC is utilized to classify units according to their economic activities.
The 2009 PSIC consists of an alpha character and 5 numeric digits. The alpha character, which represents the major division, is denoted by the characters A to S. The first two numeric digits represent the division; the first three numeric digits, the group; the first four digits, the class; and the 5 digits, the sub-class.
The size of the establishment is determined by its total employment (TE). The following are the employment size classification used in the 2010 ASPBI:
| 0 | 1 - 4 | 5 | 100 - 199 |
| 1 | 5 - 9 | 6 | 200 - 499 |
| 2 | 10 - 19 | 7 | 500 - 999 |
| 3 | 20 - 49 | 8 | 1000 - 1999 |
| 4 | 50 - 99 | 9 | 2000 and Over |
| TE Code | Total Employment | TE Code | Total Employment |
The geographic or physical location of the establishments was classified in accordance with the Philippine Standard Geographic Code (PSGC) as of December 31, 2010 which contains the latest updates on the number of regions, provinces, cities, municipalities and barangays in the Philippines.
The geographic domains of the 2010 ASPBI for establishments with TE of 20 and over are the 17 administrative regions while the whole country serves as the geographic domain for establishments with TE of less than 20.
Hence, the samples of the 2010 ASPBI with TE of 20 and over shall provide data for 17 administrative regions. For samples with TE of less than 20, the data that will be presented is limited only at the national level.
Response rate
A total of 535 or 93.5 percent of sample establishments with Total Employment of 20 and over responded. These include receipts of “good” questionnaires, partially accomplished questionnaires, reports of closed, moved out or out of scope establishments.
CONCEPTS AND DEFINITIONS OF TERMS
Economic activity or business is the activity of the establishment as classified under the 2009 Philippine Standard Industrial Classification (PSIC). Generally, the main activity of the establishment is the establishment's principal source of income. If the establishment is engaged in several activities, its main activity is that which earns the biggest income or revenue.
Total employment is the number of persons who worked in or for this establishment as of November 15, 2010.
Paid employees are all persons working in the establishment and receiving pay, as well as those working away from the establishment paid by and under the control of the establishment. Included are all employees on sick leave, paid vacation or holiday. Excluded are consultants, home workers, workers receiving pure commissions only, and workers on indefinite leave.
Salaries and wages are payments in cash or in kind to all employees, prior to deductions for employee’s contributions to SSS/GSIS, withholding tax, etc. Included are total basic pay, overtime pay, and other benefits.
Revenue is the value of goods, products/by-products sold and/or services rendered to others whether paid in cash or is considered receivable by the establishment. Valuation of products/by products sold should be in producer’s price (ex-establishment), net of discounts and allowances, including duties and charges but excluding subsidies. It also include goods transferred and/or services rendered to other establishment belonging to the same enterprise as the said establishment which should be treated as sales or as if sold to a customer; and revenue from products on a contractual basis from materials supplied by the establishment.
Cost refers to all expenses excluding compensation incurred during the year whether paid or payable. Valuation should be at purchaser price including taxes and other charges, net of discounts, rebates, returns and allowances. Goods received from and services rendered by other establishment of the same enterprise are valued as though purchased.
Valued added is gross output less intermediate cost.
Gross output is equal to the sum of total revenue (less interest income, rent income from land, dividend income, royalty income and franchise income), capital expenditures of fixed assets produced on own account, and change in inventory of goods for resale; less cost of goods purchased for sale.
Intermediate cost is equal to the sum of the following cost items: materials and supplies; fuels, lubricants, oils and greases; electricity and water; cost of industrial services done by others; cost of non-industrial services done by others (less rent expense for land); research and experimental development expense; environmental protection expense; royalty fee; franchise fee and other cost; less change in inventory of materials and supplies; fuels, lubricants, oils and greases.
Tangible Fixed assets are physical assets expected to have productive lives of more than one year and intended for use and/or being used by the establishment. Included are land, buildings, other structures and land improvements, transport equipment, machinery and equipment, furniture, fixtures, and other tangible fixed assets.
Book value of tangible fixed assets is the initial value or acquisition cost of tangible fixed assets less the accumulated depreciation.
Gross additions to tangible fixed assets is the sum of cost of new and used fixed assets acquired during the year, cost of alteration and improvements done by others and cost of fixed assets produced by the establishment less the value of sales of fixed assets during the year.
Inventories refer to the stocks of goods owned by and under the control of the establishment as of a fixed date, regardless of where the stocks are located. Valuation should be at current replacement cost in purchaser’s price at the indicated dates. Replacement cost is the cost of an item in terms of its present price rather than its original price.
Change in Inventories is equivalent to the value of inventories at the end of the year less the value at the beginning of the year.
Subsidies are special grants in the form of financial assistance or tax exemption or tax privilege given by the government to aid and develop an industry or production and to protect it against competition.
Source: National Statistics Office
Manila, Philippines