
Highlights of the 2023 Annual International Merchandise Trade Statistics of the Philippines

A. TOTAL EXTERNAL TRADE AND BALANCE OF TRADE
1. Total external trade decreased by 7.8 percent
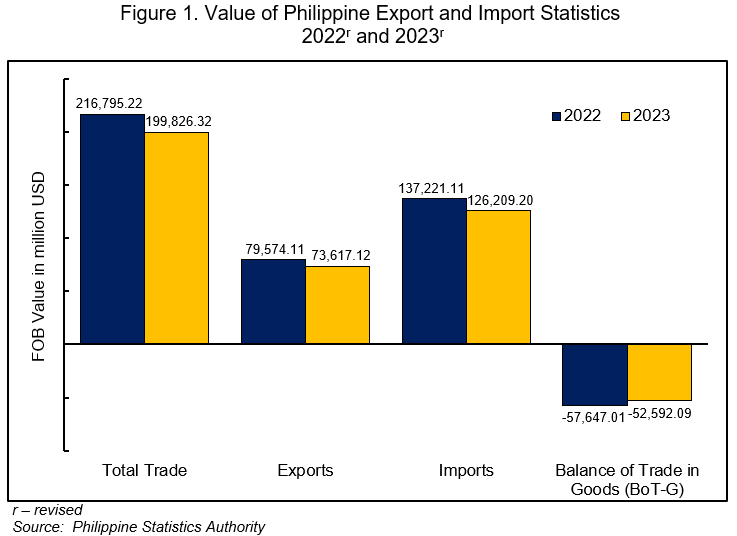
In 2023, the country’s total external trade in goods amounted to USD 199.83 billion, which indicates an annual decline of 7.8 percent from the USD 216.80 billion total external trade in the previous year. In 2022 and 2021, total external trade in goods registered annual increments of 13.2 percent and 23.6 percent, respectively. (Tables A and 1)
Of the total external trade in 2023, 63.2 percent were imported goods, while the remaining were exported goods.
2. Trade deficit posted an annual decrease
The balance of trade in goods (BoT-G) is the difference between the value of exports and imports. The BoT-G in 2023 amounted to USD -52.59 billion, indicating a trade deficit with an annual decline of 8.8 percent. In 2022, the trade deficit recorded an annual increase of 36.6 percent, while an annual increment of 71.5 percent was posted in 2021. (Figure 1, and Tables A and 4)
B. EXPORTS
1. Sales from export posted a negative growth
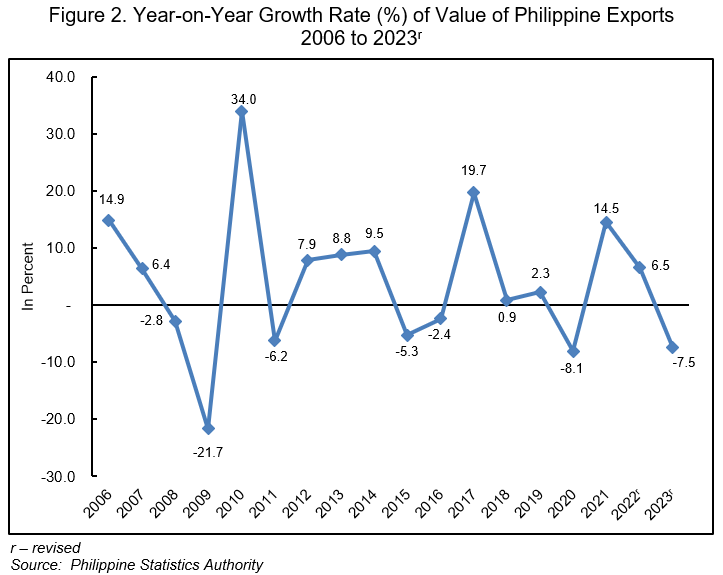
The country’s total export sales in 2023 amounted to USD 73.62 billion, indicating an annual decrease of 7.5 percent from the USD 79.57 billion total exports in the previous year. In 2022 and 2021, the total exports recorded annual increases of 6.5 percent and 14.5 percent, respectively. (Figures 1 and 2, and Tables A and 3)
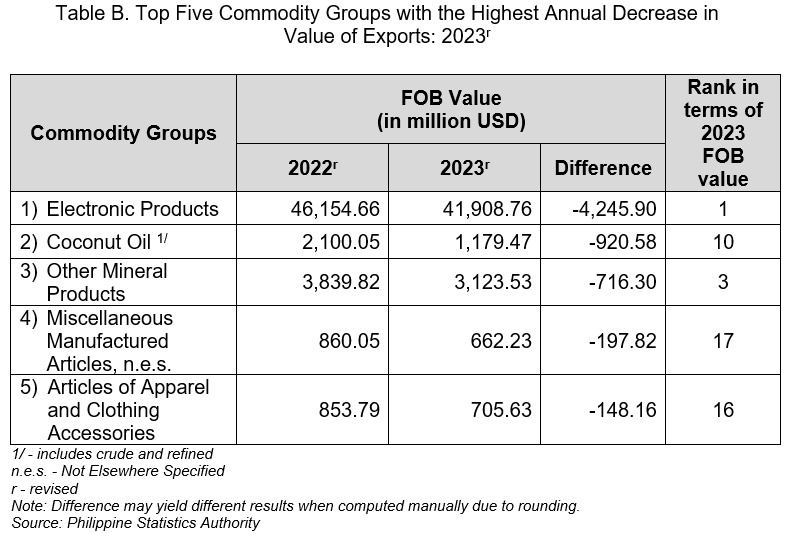
The commodity group with the highest annual decrement in the value of exports in 2023 was electronic products with USD 4.25 billion. This was followed by coconut oil with an annual decrease of USD 920.58 million, and other mineral products with an annual decline of USD 716.30 million. (Tables B and 5)
2. Electronic products commodity group remained the highest on export sales
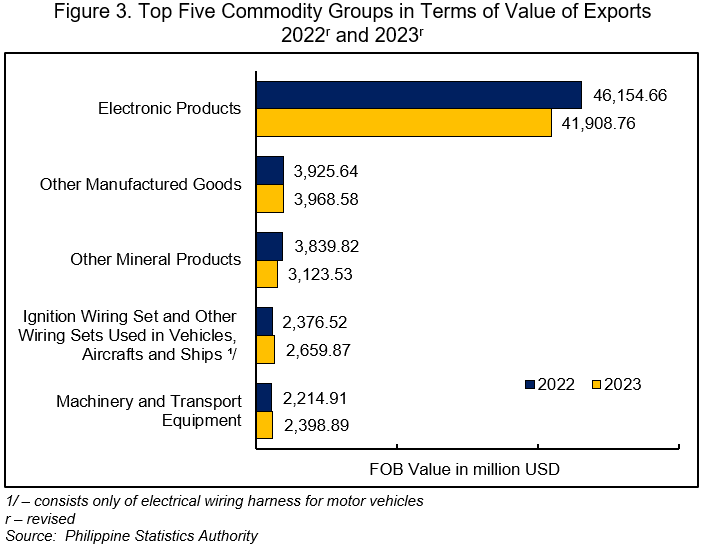
By commodity group, electronic products continued to be the country’s top export in 2023 with total earnings of USD 41.91 billion or 56.9 percent of the country’s total exports during the period. This was followed by other manufactured goods with an export value of USD 3.97 billion (5.4%), and other mineral products with USD 3.12 billion (4.2%). (Figure 3 and Table 5)
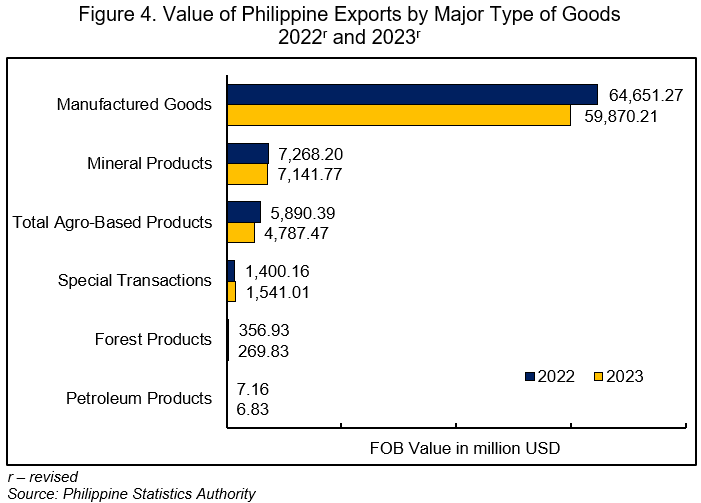
3. Manufactured goods still comprised the largest portion of total exports among major types of goods
By major type of goods, exports of manufactured goods contributed the largest to the country’s total exports in 2023 amounting to USD 59.87 billion or a share of 81.3 percent. This was followed by mineral products with a share of USD 7.14 billion (9.7%), and total agro-based products, which contributed USD 4.79 billion (6.5%). (Figure 4 and Table 8)
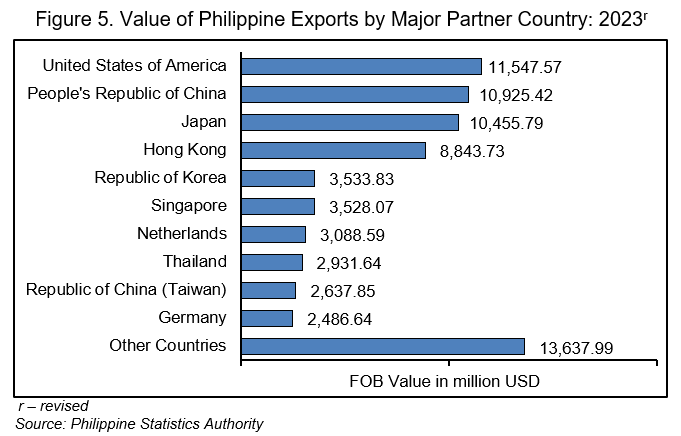
4. United States of America (USA) contributed the highest to the total export value
By major trading partner, exports to USA comprised the highest export value amounting to USD 11.55 billion or a share of 15.7 percent to the country’s total exports in 2023.
Completing the top five major export trading partners for this year with their export values and percent shares to the total exports were:
a. People’s Republic of China, USD 10.93 billion (14.8%);
b. Japan, USD 10.46 billion (14.2%);
c. Hong Kong, USD 8.84 billion (12.0%); and
d. Republic of Korea, USD 3.53 billion (4.8%). (Figure 5 and Table 7)
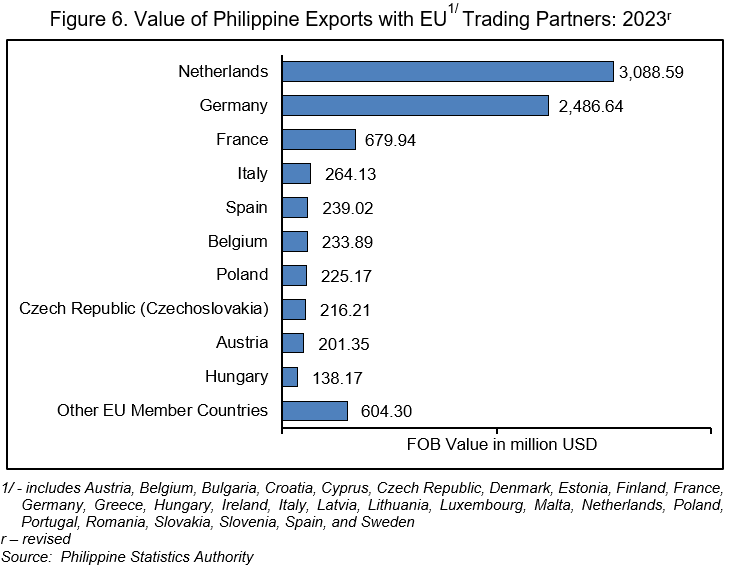
5. Netherlands topped the total exports among European Union (EU) member countries
Exports to EU reached USD 8.38 billion or 11.4 percent of the total export revenue in 2023. Revenue from exports to Netherlands had the highest share of USD 3.09 billion or 36.9 percent of the total exports to EU member countries. (Figure 6 and Table 12)
The top five exported goods to EU member countries with their export revenue and percent shares to the total EU exports in 2023 were:
a. electronic products, USD 5.92 billion (70.7%);
b. coconut oil, USD 597.36 million (7.1%);
c. other manufactured goods, USD 288.56 million (3.4%);
d. machinery and transport equipment, USD 209.55 million (2.5%); and
e. tuna, USD 203.22 million (2.4%). (Table 13)
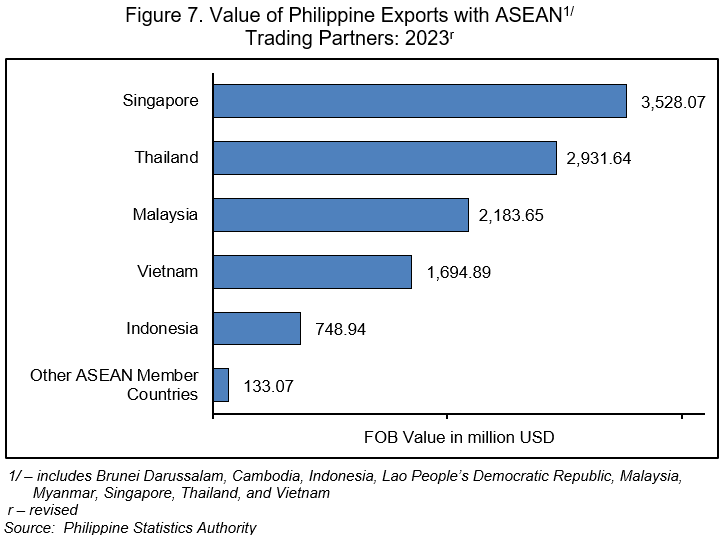
6. Singapore led the Association of Southeast Asian Nations (ASEAN) member countries in terms of total exports
The total exports to ASEAN member countries reached USD 11.22 billion or 15.2 percent of the country’s total export revenue in 2023.
Exports to Singapore accounted for the highest share of USD 3.53 billion or 31.4 percent of the total exports to ASEAN member countries. (Figure 7 and Table 12)
The leading export commodities to ASEAN member countries and their corresponding export values and percent shares to the total ASEAN exports during the year were:
a. electronic products, USD 7.11 billion (63.3%);
b. cathodes and sections of cathodes, of refined copper, USD 865.80 million (7.7%);
c. other manufactured goods, USD 672.05 million (6.0%);
d. machinery and transport equipment, USD 397.86 million (3.5%); and
e. metal components, USD 393.20 million (3.5%). (Table 13)
7. USA topped among Asia Pacific Economic Cooperation (APEC) member countries
Exports to APEC member countries amounted to USD 61.34 billion or 83.3 percent of the total exports in 2023.
Exports to USA was recorded as the highest at USD 11.55 billion or 18.8 percent of the country’s total exports to APEC member countries. (Figure 8 and Table 15)

The top five exported goods to APEC member countries and their corresponding export sales and percent shares to the total APEC exports during the year were:
a. electronic products, USD 34.76 billion (56.7%);
b. other manufactured goods, USD 3.20 billion (5.2%);
c. other mineral products, USD 3.02 billion (4.9%);
d. ignition wiring set and other wiring sets used in vehicles, aircrafts and ships, USD 2.64 billion (4.3%); and
e. machinery and transport equipment, USD 2.01 billion (3.3%). (Table 16)
8. East Asia contributed the highest export value by geographic region
By geographic region, East Asia comprised the highest export value in 2023 amounting to USD 36.41 billion (49.5%). This was followed by Northern America with an export value of USD 12.13 billion (16.5%) and Southeast Asia with USD 11.22 billion (15.2%) worth of export value. (Figure 9 and Table 18)

C. IMPORTS
1. Import value decreased
The total imported goods in 2023 amounted to USD 126.21 billion, indicating an annual decline of 8.0 percent from the USD 137.22 billion in the previous year. In 2022 and 2021, the total imports recorded corresponding annual increases of 17.4 percent and 30.1 percent. (Figures 1 and 10, and Tables A and 2)

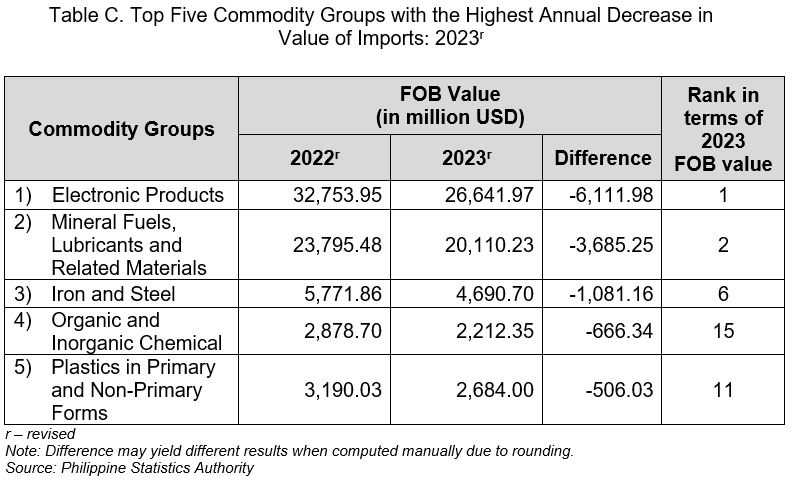
In 2023, the commodity group with the highest annual decrement in the value of imported goods was electronic products with USD 6.11 billion. This was followed by mineral fuels, lubricants and related materials, which declined by USD 3.69 billion, and iron and steel with an annual decrease of USD 1.08 billion. (Tables C and 6)
2. Electronic products recorded the highest import value among commodity groups
The commodity group with the highest import value in 2023 was electronic products, which amounted to USD 26.64 billion or a share of 21.1 percent to the country’s total imports. This was followed by mineral fuels, lubricants and related materials at USD 20.11 billion (15.9%), and transport equipment at USD 12.45 billion (9.9%). (Figure 11 and Table 6)

3. Imports of raw materials and intermediate goods contributed the highest among major types of goods
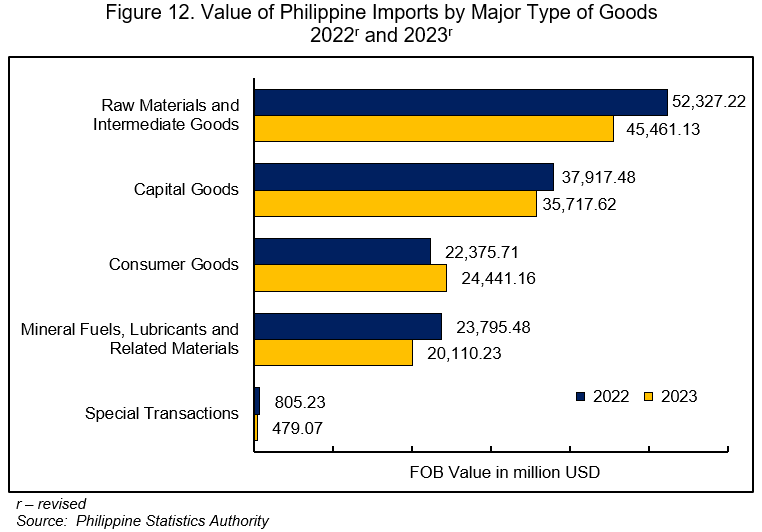
By major type of goods, imports of raw materials and intermediate goods accounted for the largest share of the country’s total imports in 2023, amounting to USD 45.46 billion (36.0%). This was followed by capital goods with a share of USD 35.72 billion (28.3%), and consumer goods with an import value of USD 24.44 billion (19.4%). (Figure 12 and Table 9)
4. People’s Republic of China had the highest import value
People’s Republic of China was the country’s largest supplier of imported goods valued at USD 29.39 billion or 23.3 percent of the country’s total imports in 2023.
Completing the top five major import trading partners for this year with their corresponding import values and percent shares to the total imports were:
a. Indonesia, USD 11.51 billion (9.1%);
b. Japan, USD 10.29 billion (8.2%);
c. Republic of Korea, USD 8.49 billion (6.7%); and
d. USA, USD 8.42 billion (6.7%). (Figure 13 and Table 7)

5. Germany topped the total imports among EU member countries
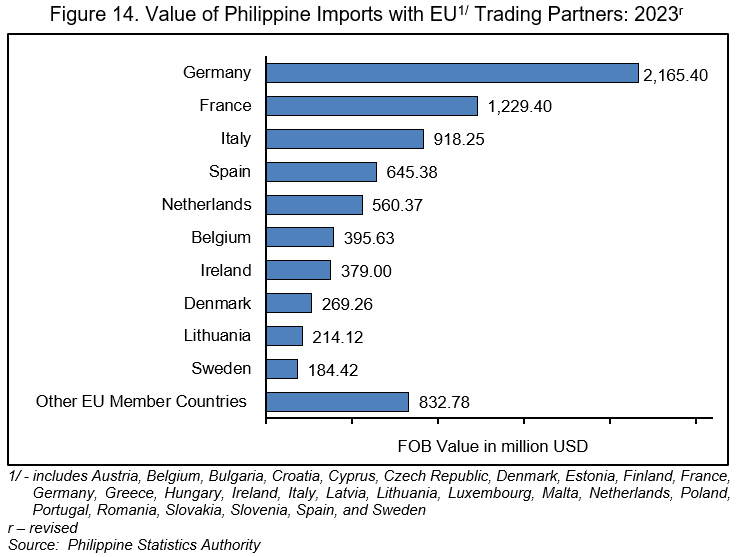
The total imports from EU member countries amounted to USD 7.79 billion or 6.2 percent of the total imports in 2023. Among the EU member countries, import payments from Germany was the highest at USD 2.17 billion or 27.8 percent of the country’s total import value from EU member countries. (Figure 14 and Table 12)
The leading imported goods from EU member countries and their corresponding import payments and percent shares to the total EU imports during the year were:
a. electronic products, USD 1.36 billion (17.4%);
b. transport equipment, USD 1.18 billion (15.1%);
c. medicinal and pharmaceutical products, USD 853.15 million (10.9%);
d. industrial machinery and equipment, USD 654.44 million (8.4%); and
e. other food and live animals, USD 548.52 million (7.0%). (Table 14)
6. Indonesia led the ASEAN member countries in terms of imports
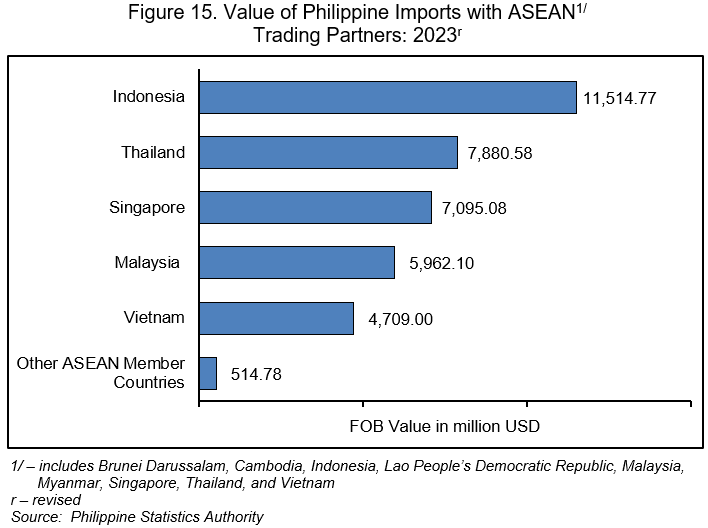
The total imports from ASEAN member countries was registered at USD 37.68 billion or 29.9 percent of the country’s total imports in 2023. Majority of the imports came from Indonesia, which amounted to USD 11.51 billion or 30.6 percent of the total imports from ASEAN member countries. (Figure 15 and Table 12)
The top five imported commodities from ASEAN member countries and their corresponding import values and percent shares to the total ASEAN imports in 2023 were:
a. mineral fuels, lubricants and related materials, USD 7.70 billion (20.4%);
b. transport equipment, USD 7.34 billion (19.5%);
c. electronic products, USD 5.41 billion (14.4%);
d. other food and live animals, USD 2.32 billion (6.2%); and
e. cereals and cereal preparations, USD 1.87 billion (5.0%). (Table 14)
7. People’s Republic of China topped the total imports from APEC member countries
Import payments from APEC member countries amounted to USD 106.43 billion or 84.3 percent of the total imports in 2023. People’s Republic of China registered the highest import value among APEC member countries, which amounted to USD 29.39 billion or 27.6 percent of the country’s total imports from APEC member countries. (Figure 16 and Table 15)
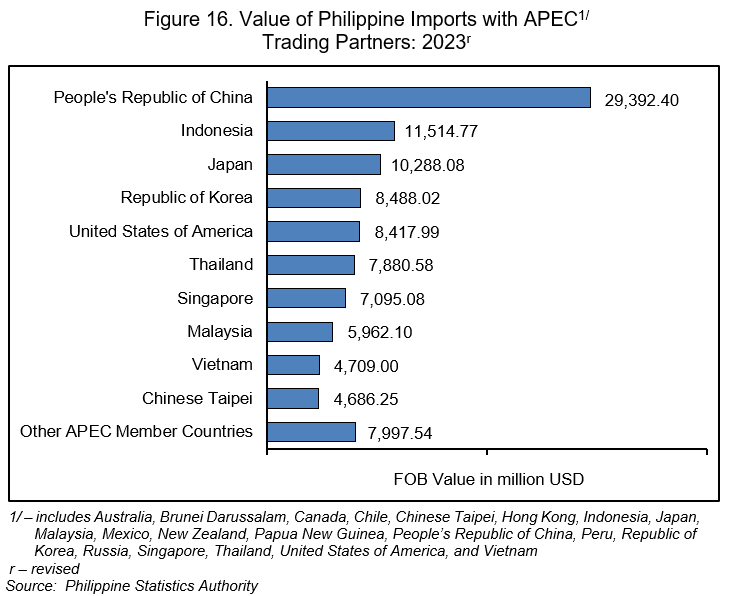
The top five imported goods from APEC member countries and their corresponding import payments and percent shares to the total APEC imports during the year were:
a. electronic products, USD 24.70 billion (23.2%);
b. mineral fuels, lubricants and related materials, USD 15.07 billion (14.2%);
c. transport equipment, USD 10.82 billion (10.2%);
d. industrial machinery and equipment, USD 4.77 billion (4.5%); and
e. iron and steel, USD 4.47 billion (4.2%). (Table 17)
8. East Asia contributed the highest import value among geographic regions
By geographic region, East Asia had the highest import value of USD 54.99 billion (43.6%) in 2023. This was followed by Southeast Asia with import value amounting to USD 37.68 billion (29.9%) and Northern America valued at USD 9.32 billion (7.4%). (Figure 17 and Table 18)

DIVINA GRACIA L. DEL PRADO, PhD
Assistant Secretary
Deputy National Statistician
Sectoral Statistics Office