PRODUCTION
Value of Production Index remains at downward trend
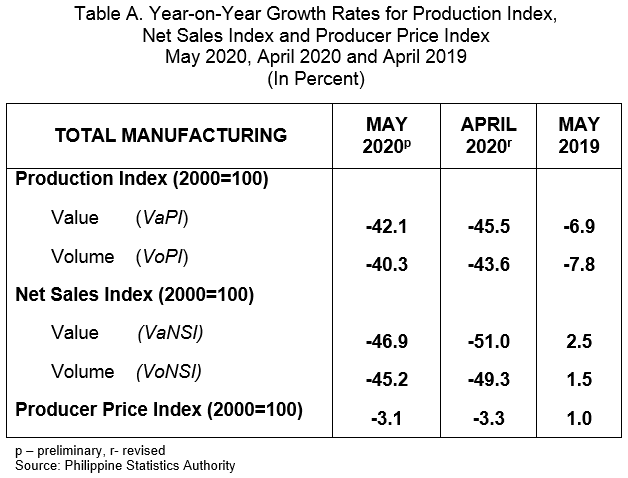
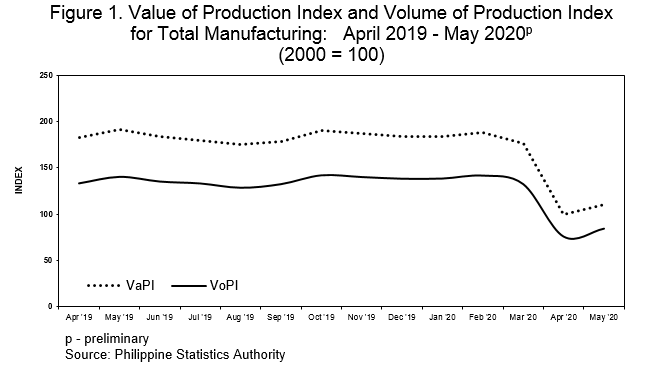
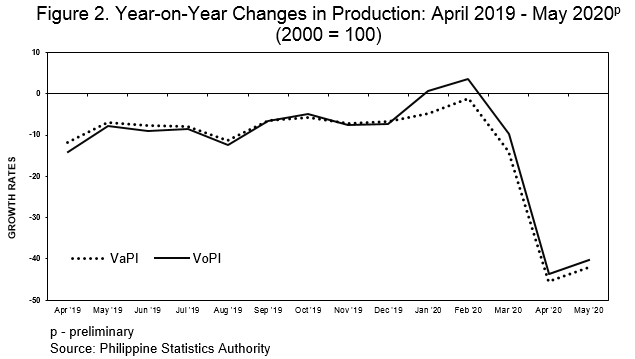
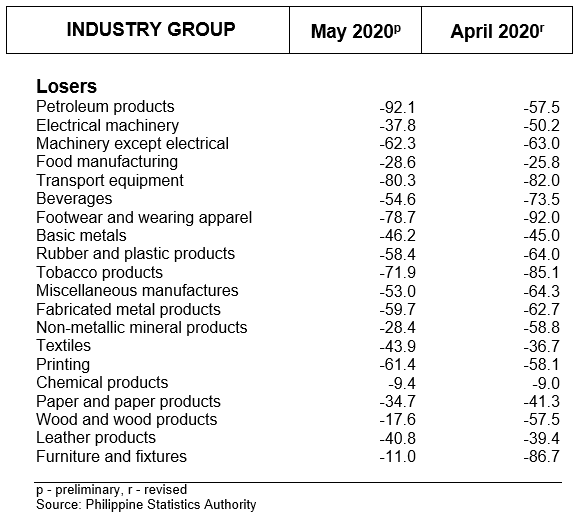
Value of Production Index (VaPI) for Manufacturing sector still posted a declining trend with an annual rate of -42.1 percent in May 2020. This was slower than the annual growth rate of VaPI at -45.5 percent in the previous month. In May of the previous year, year-on-year growth was -6.9 percent. (Table A)
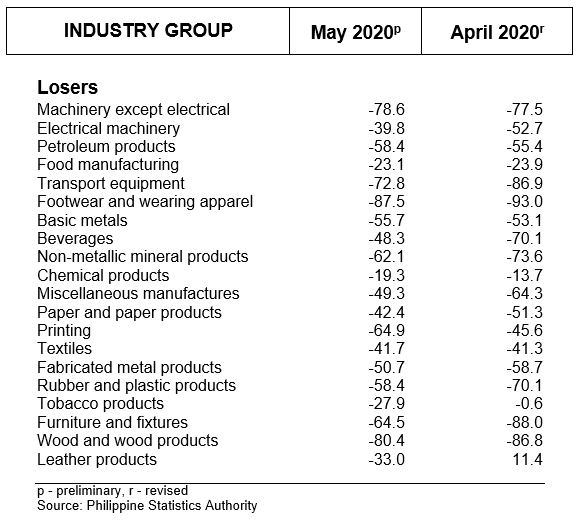
Pushing down the VaPI this month were the decreases in the indices of all the 20 major industry groups. Among these, the top three industry groups with negative growth rates were petroleum products (-92.1%), transport equipment (-80.3%), and, footwear and wearing apparel (-78.7%). (Tables 1 and 1-A)
Volume of Production Index still at a negative two-digit annual growth rate
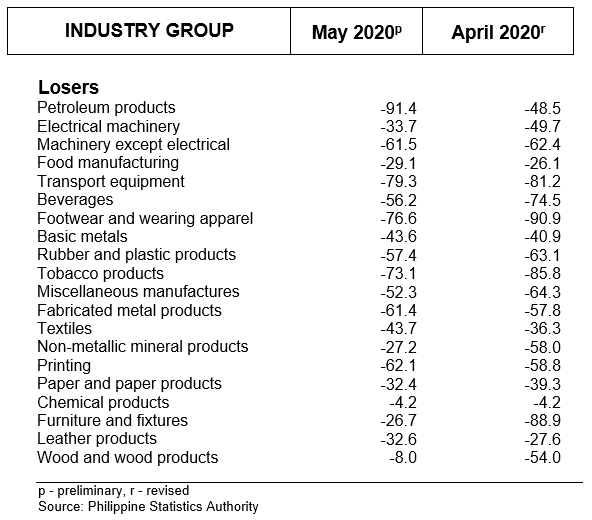
Volume of Production Index (VoPI), on a year-on-year basis, continued to drop at an annual rate of 40.3 percent in May 2020. This decline was also slower than the reported decrease in the previous month at 43.6 percent but higher than the annual decline in April 2019 at 7.8 percent. (Table A)
The reduction in the indices of all industry groups pulled down the VoPI during the month with petroleum products (-91.4%), transport equipment (-79.3%), and, footwear and wearing apparel (-76.6%). (Tables 1-B and 2)
NET SALES
Value of Net Sales Index drops further
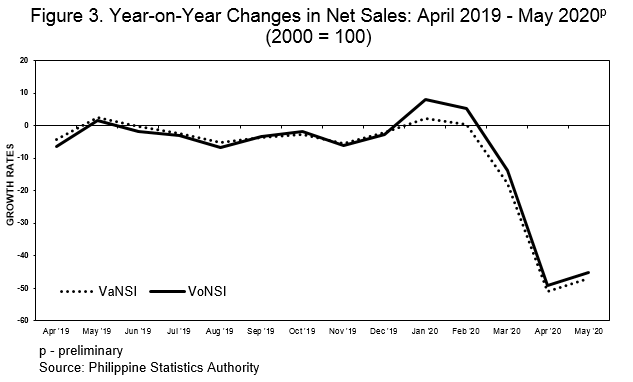
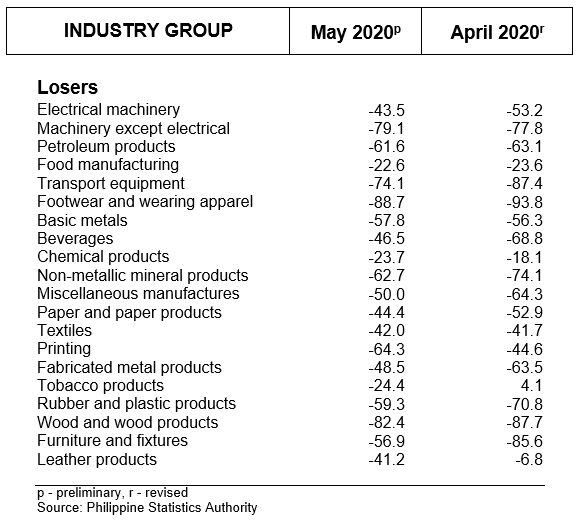
The Value of Net Sales Index (VaNSI) also continued to drop at an annual rate of 46.9 percent in May 2020, from a negative growth rate of 51.0 percent in the previous month. On the other hand, VaNSI increased with an annual rate of 2.5 percent in May 2019. (Table A)
The decline of VaNSI in May 2020 was due to the decreases in the indices of all industry groups led by footwear and wearing apparel (-88.7%), wood and wood products (-82.4%) and machinery except electrical (-79.1%). (Tables 2-A and 3)
Volume of Net Sales Index declines
The Volume of Net Sales Index (VoNSI), on a year-on-year basis, maintains its downward trend at -45.2 percent in May 2020. In the previous month, the annual decrease was higher at 49.3 percent. In contrast, VoNSI in May 2019 climbed by 1.5 percent. (Table A)
The downturn was brought about by the contractions in the indices of all the industry groups. Two of these industry groups exhibited a decrease of more than 80 percent, namely, footwear and wearing apparel (-87.5%) and wood and wood products (-80.4%). (Tables 2-B and 4)
CAPACITY UTILIZATION
Average Capacity Utilization Rate for manufacturing improves
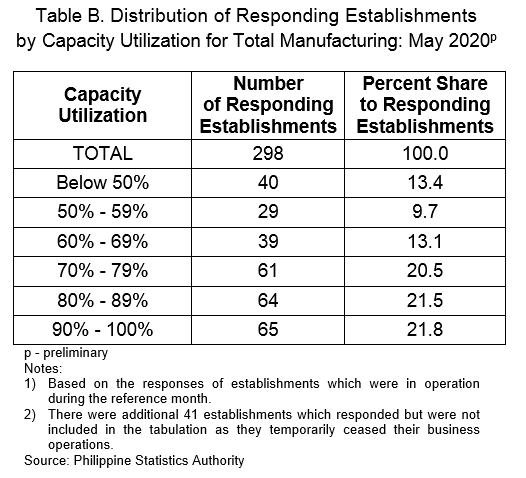
Based on the responding establishments, average capacity utilization rate for total manufacturing in May 2020 was posted at 73.4 percent which was higher than the April 2020 report of 71.2 percent.
Five of the 20 industry groups had at least 80 percent capacity utilization rate which was led by wood and wood products (91.7%), textiles (90.6%), footwear and wearing apparel (85.8%), rubber and plastic products (82.2%) and electrical machinery (81.4%). (Table 6)
More than one-fifth of total responding manufacturing establishments operate at full capacity
The proportion of establishments that operated at full capacity (90% to 100%) was more than one-fifth (21.8%) of the total number of responding establishments for manufacturing. More than two-fifths (42.0%) operated at 70 to 89 percent capacity while more than a third (36.2%) operated below 70 percent capacity. (Table B)
(Sgd.) DENNIS S. MAPA, Ph. D.
Undersecretary
National Statistician and Civil Registrar General
by Industry Group
April and May 2020
(2000 = 100)
by Industry Group
April and May 2020
(2000 = 100)
by Industry Group
April and May 2020
(2000 = 100)
by Industry Group
April and May 2020
(2000 = 100)