
|
Table A Year-on-Year Growth Rates for Production Index, Net Sales Index and Producer Price Index: September 2019 and September 2018 (2000=100) |
||
|---|---|---|
|
TOTAL MANUFACTURING |
SEPTEMBER
2019
|
SEPTEMBER
2018
|
|
Production Index |
|
|
|
Value (VaPI) |
-2.3 |
3.2 |
|
Volume (VoPI) |
-3.0 |
1.3 |
|
Net Sales Index |
|
|
|
Value (VaNSI) |
-2.5 |
6.7 |
|
Volume (VoNSI) |
-2.4 |
4.7 |
|
Producer Price Index |
-0.2r |
1.9 |
r - revised
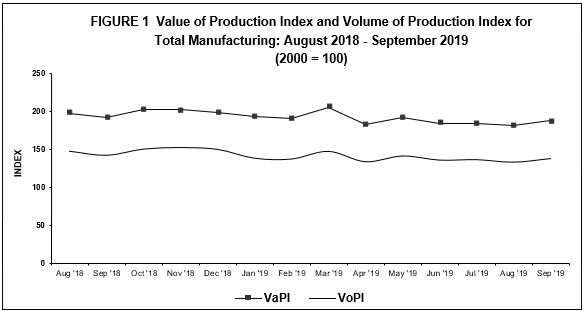
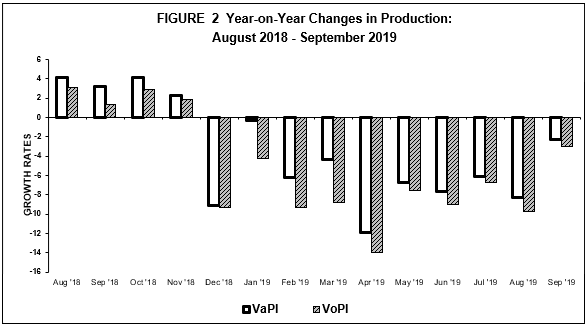
- Value of Production Index slightly drops in September 2019
Based on the preliminary results of the Monthly Integrated Survey of Selected Industries (MISSI), the Value of Production Index (VaPI) depicted a year-on-year decrement of 2.3 percent in September 2019, from 3.2 percent growth in the same month of the previous year.
Nine out of the 20 major industry groups registered annual declines, with two-digit decreases noted in the following major industry groups: leather products (-28.0%), petroleum products (-25.2%), electrical machinery (-14.6%) and miscellaneous manufactures (-11.9%). Refer to Tables1 and 1-A.
- Volume of Production Index also decreases
The Volume of Production Index (VoPI) showed an annual drop of 3.0 percent in September 2019, from 1.3 percent increase during the same month of the previous year.
Among the eight major industries that exhibited declines in VoPI, five major industries had two-digit decreases, namely: furniture and fixtures (-30.1%), leather products (-22.3%), petroleum products (-17.3%), miscellaneous manufactures (-13.5%) and electrical machinery (-10.4%). Refer to Tables 1-B and 2.
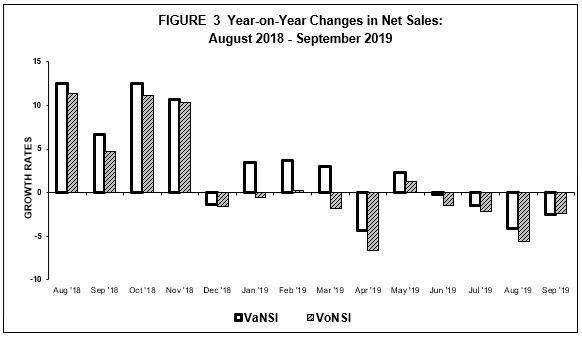
- Value of Net Sales Index decelerates
The Value of Net Sales Index (VaNSI) went down at an annual rate of 2.5 percent in September 2019. In the same month of the previous year, VaNSI posted a positive growth rate of 6.7 percent.
The decrement in September 2019 of VaNSI was mainly influenced by the decreases in 10 major sectors led by machinery except electrical (-15.9%), textiles (-14.5%), and miscellaneous manufactures (-10.2%). Refer to Tables 2-A and 3.
- Volume of Net Sales Index posts negative rate
Volume of Net Sales Index (VoNSI) likewise fell by 2.4 percent in September 2019, from 4.7 percent increment in the same month of the previous year.
The slowdown was due to the annual decreases observed in nine major industry groups, with two-digit negative annual rates reported by the following: furniture and fixtures (-27.6%), textiles (-13.8%), machinery except electrical (-11.7%) and miscellaneous manufactures (-11.3%). Refer to Tables 2-B and 4.
- Average Capacity Utilization Rate is highest for petroleum products
Average capacity utilization rate for total manufacturing in September 2019 was posted at 84.4 percent. Thirteen (65%) of the 20 major industries had at least 80 percent capacity utilization rates during the month. These were:
- petroleum products (89.9%)
- basic metals (88.8%)
- machinery except electrical (86.5%)
- non-metallic mineral products (86.3%)
- food manufacturing (85.1%)
- electrical machinery (85.1%)
- chemical products (84.9%)
- printing(84.0%)
- paper and paper products (83.9%)
- rubber and plastic products (83.4%)
- wood and wood products (82.0%)
- textiles (80.2%)
- leather products (80.1%)
- More than a quarter of total manufacturing establishments operate at full capacity
The proportion of establishments that operated at full capacity (90% to 100%) was more than one-fourth (27.4%) of the total number of establishments for manufacturing in September 2019. About 54 percent of the total establishments during the month operated at 70 percent to 89 percent capacity, while almost one-fifth (18.5%) operated below 70 percent capacity.Refer to Tables B and 6.
|
Table B Distribution of Key Manufacturing Establishments by Capacity Utilization for Total Manufacturing: September 2019 |
||
|---|---|---|
|
Capacity Utilization |
Number of Establishments |
Percent Share |
|
Below 50% |
34 |
3.9 |
|
50% - 59% |
40 |
4.6 |
|
60% - 69% |
87 |
10.0 |
|
70% - 79% |
180 |
20.5 |
|
80% - 89% |
295 |
33.6 |
|
90% - 100% |
240 |
27.4 |
CLAIRE DENNIS S. MAPA, Ph. D.
Undersecretary
National Statistician and Civil Registrar General
TABLE 1-A Value of Production Index, August 2019 and September 2019
(2000 =100)
|
Industry Group |
Year-on-Year Growth (%) |
|
| September 2019 |
August 2019
(revised)
|
|
|
Gainers |
|
|
|
Tobacco products |
54.4 |
61.3 |
|
Printing |
79.9 |
59.9 |
|
Machinery except electrical |
9.1 |
-0.9 |
|
Beverages |
18.0 |
0.2 |
|
Basic Metals |
8.1 |
3.3 |
|
Rubber and plastic products |
10.5 |
12.7 |
|
Fabricated metal products |
19.2 |
15.9 |
|
Paper and paper products |
10.1 |
1.0 |
|
Furniture and fixtures |
14.3 |
-9.1 |
|
Wood and wood products |
14.1 |
3.4 |
|
Non-metallic mineral products |
2.1 |
12.7 |
|
Losers |
|
|
|
Petroleum products |
-25.2 |
-61.8 |
|
Electrical machinery |
-14.6 |
-12.9 |
|
Transport equipment |
-9.2 |
-18.5 |
|
Food manufacturing |
-2.2 |
2.5 |
|
Miscellaneous manufactures |
-11.9 |
-16.5 |
|
Footwear and wearing apparel |
-3.4 |
-4.9 |
|
Textiles |
-5.6 |
-6.5 |
|
Chemical products |
-1.2 |
-1.4 |
|
Leather products |
-28.0 |
2.7 |
TABLE 1-B Volume of Production Index, August 2019 and September 2019
(2000 = 100)
|
Industry Group |
Year-on-Year Growth (%) |
|
| September 2019 |
August 2019
(revised)
|
|
|
Gainers |
|
|
|
Machinery except electrical |
13.1 |
1.4 |
|
Tobacco products |
48.6 |
55.3 |
|
Printing |
79.9 |
59.9 |
|
Basic metals |
16.9 |
11.7 |
|
Beverages |
13.9 |
-3.3 |
|
Fabricated metal products |
33.3 |
25.1 |
|
Food manufacturing |
2.8 |
7.9 |
|
Chemical products |
5.1 |
5.4 |
|
Paper and paper products |
13.2 |
3.1 |
|
Footwear and wearing apparel |
8.1 |
4.6 |
|
Rubber and plastic products |
6.6 |
8.4 |
|
Wood and wood products |
22.7 |
13.4 |
|
Losers |
|
|
|
Electrical machinery |
-10.4 |
-9.7 |
|
Petroleum products |
-17.3 |
-59.0 |
|
Transport equipment |
-8.3 |
-18.4 |
|
Miscellaneous manufactures |
-13.5 |
-19.9 |
|
Furniture and fixtures |
-30.1 |
-44.9 |
|
Textiles |
-3.5 |
-3.3 |
|
Non-metallic mineral products |
-1.8 |
9.0 |
|
Leather products |
-22.3 |
16.8 |
(2000 =100)
|
Industry Group |
Year-on-Year Growth (%) |
|
| September 2019 |
August 2019
(revised)
|
|
|
Gainers |
|
|
|
Beverages |
14.7 |
4.5 |
|
Non-metallic mineral products |
20.7 |
7.8 |
|
Chemical products |
5.4 |
7.1 |
|
Fabricated metal products |
25.9 |
25.2 |
|
Printing |
19.7 |
19.0 |
|
Furniture and fixtures |
16.8 |
-5.5 |
|
Footwear and wearing apparel |
2.1 |
-3.0 |
|
Wood and wood products |
9.5 |
-4.4 |
|
Tobacco products |
1.3 |
36.7 |
|
Paper and paper products |
0.4 |
-6.8 |
|
Losers |
|
|
|
Machinery except electrical |
-15.9 |
-13.2 |
|
Petroleum products |
-9.6 |
-9.0 |
|
Food manufacturing |
-5.9 |
-2.9 |
|
Electrical machinery |
-4.0 |
-14.5 |
|
Transport equipment |
-8.7 |
-6.9 |
|
Basic metals |
-8.6 |
-13.8 |
|
Textiles |
-14.5 |
-14.4 |
|
Miscellaneous manufactures |
-10.2 |
-16.0 |
|
Rubber and plastic products |
-1.7 |
-5.0 |
|
Leather products |
-8.5 |
-8.4 |
TABLE 2-B Volume of Net Sales Index, August 2019 and September 2019
(2000 = 100)
|
Industry Group |
Year-on-Year Growth (%) |
|
| September 2019 |
August 2019
(revised)
|
|
|
Gainers |
|
|
|
Chemical products |
14.2 |
14.5 |
|
Fabricated metal products |
40.8 |
35.1 |
|
Beverages |
10.7 |
0.8 |
|
Non-metallic mineral products |
16.4 |
4.2 |
|
Footwear and wearing apparel |
14.9 |
6.7 |
|
Printing |
19.7 |
19.0 |
|
Petroleum products |
1.4 |
-2.4 |
|
Wood and wood products |
19.4 |
4.8 |
|
Electrical machinery |
0.4 |
-10.9 |
|
Paper and paper products |
1.8 |
-4.8 |
|
Leather products |
1.7 |
4.2 |
|
Losers |
|
|
|
Machinery except electrical |
-11.7 |
-6.3 |
|
Textiles |
-13.8 |
-11.5 |
|
Miscellaneous manufactures |
-11.3 |
-19.5 |
|
Transport equipment |
-4.8 |
-6.7 |
|
Furniture and fixtures |
-27.6 |
-42.7 |
|
Food manufacturing |
-0.7 |
2.2 |
|
Rubber and plastic products |
-5.1 |
-8.6 |
|
Tobacco products |
-2.6 |
31.3 |
|
Basic metals |
-0.7 |
-6.7 |