
|
Table A Year-on-Year Growth Rates for Production Index, Net Sales Index and Producer Price Index: October 2018 and October 2017 |
||
|---|---|---|
|
TOTAL MANUFACTURING |
OCTOBER
2018
|
OCTOBER
2017
|
|
Production Index (2000=100) |
|
|
|
Value (VaPI) |
3.1 |
-6.0 |
|
Volume (VoPI) |
3.9 |
-6.6 |
|
Net Sales Index (2000=100) |
|
|
|
Value (VaNSI) |
10.9 |
-8.8 |
|
Volume (VoNSI) |
11.5 |
-9.4 |
|
Producer Price Index (2000=100) |
-0.5r |
-0.6 |
r - revised
- Value of Production Index keeps positive rate in October 2018
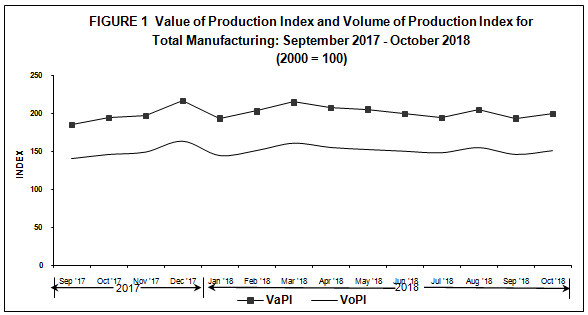
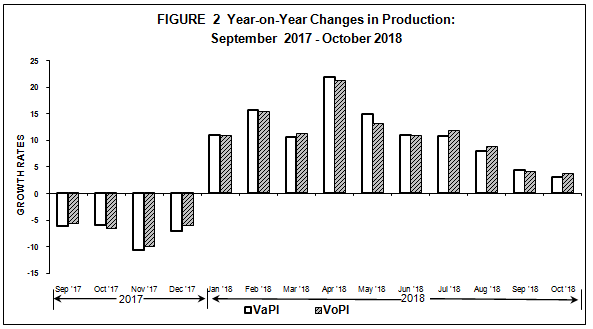
The Value of Production Index (VaPI) for manufacturing recorded an annual increment of 3.1 percent in October 2018. In the same month of the previous year, VaPI dropped by 6.0 percent.
Nine of the 11 major industry groups significantly contributed to the growth of VaPI which was led by petroleum products, with a two-digit increase of 53.0 percent. Other major industry groups with two-digit increases were: textiles (49.7%), miscellaneous manufactures (36.9%), electrical machinery (24.4%), beverages (19.8%), paper and paper products (16.7%), machinery except electrical (14.7%), wood and wood products (11.8%) and transport equipment (10.1%). Refer to Tables1-A and 1.
- Volume of Production Index sustains growth
Volume of Production Index (VoPI) leaped as it posted an annual increment of 3.9 percent in October 2018. During the same month of 2017, year-on-year growth rate of VoPI dropped by 6.6 percent.
Among the 13 major industry groups that reported increases in VoPI, eight major industries recorded two-digit growths, namely: textiles (41.9%), miscellaneous manufactures (31.2%), petroleum products (30.8%), machinery except electrical (17.6%), wood and wood products (17.1%), electrical machinery (16.9%), non-metallic mineral products (11.9%) and paper and paper products (10.7%). Refer to Tables 1-B and 2.
- Value of Net Sales Index exhibits a two-digit increase
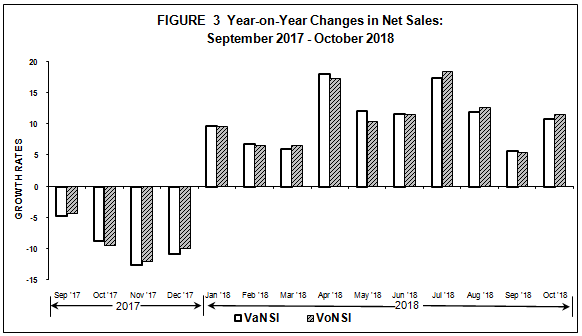
The Value of Net Sales Index (VaNSI) climbed to 10.9 percent in October 2018. During the same month of the previous year, VaNSI declined by 8.8 percent.
Of the 16 major sectors that reflected increases in VaNSI, 11 major industry groups exhibited two-digit growths led by furniture and fixtures with 51.3 percent increase. Other major industries with two-digit annual growths were tobacco products (44.6%), petroleum products (37.4%), miscellaneous manufactures (28.1%), wood and wood products (21.2%), paper and paper products (18.2%), electrical machinery (16.3%), transport equipment (15.9%), footwear and wearing apparel (15.0%), food manufacturing (13.2%) and rubber and plastic products (13.2%). Refer toTables 2-A and 3.
- Volume of Net Sales Index also expands
The Volume of Net Sales Index (VoNSI) similarly posted a year-on-year contraction of 11.5 percent in October 2018. In the same month of the previous year, VoNSI declined by 9.4 percent.
Furniture and fixtures with a 64.6 percent growth, contributed largely to the increase of VoNSI. This was followed by 10 other major industries that registered two-digit increments in VoNSI, namely: wood and wood products (26.4%), tobacco products (22.2%), non-metallic mineral products (20.0%), rubber and plastic products (17.4%), miscellaneous manufactures (16.7%), petroleum products (16.4%), transport equipment (15.8%), paper and paperproducts (14.8%), footwear and wearing apparel (13.6%) and food manufacturing (13.4%). Refer to Tables 2-B and 4.
Average Capacity Utilization Rate is highest for petroleum products
Average capacity utilization rate in October 2018 for total manufacturing was recorded at 84.3 percent. Fifty-five percent or 11 of the 20 major industries operated at least 80 percent capacity utilization rates. These are:
- petroleum products (89.9%)
- basic metals (88.9%)
- non-metallic mineral products (86.5%)
- machinery except electrical (86.1%)
- electrical machinery (85.2%)
- food manufacturing (85.0%)
- chemical products (85.0%)
- paper and paper products (83.8%)
- rubber and plastic products (83.5%)
- wood and wood products (81.6%)
- textiles (80.4%)
The proportion of establishments that operated at full capacity (90% to 100%) was more than one-fourth (26.6%) of the total number of establishments in October 2018. About 55.1 percent of the total establishments operated at 70 percent to 89 percent capacity while almost one-fifth (18.3%) of the total establishments operated below 70 percent capacity. Refer to Tables B and 6.
|
Table B Distribution of Key Manufacturing Establishments by Capacity Utilization for Total Manufacturing: October 2018 |
|
|---|---|
|
Capacity Utilization |
Percent Share |
|
Below 50% |
3.6 |
|
50% - 59% |
4.5 |
|
60% - 69% |
10.2 |
|
70% - 79% |
21.7 |
|
80% - 89% |
33.4 |
|
90% - 100% |
26.6 |
LISA GRACE S. BERSALES, Ph. D.
Undersecretary
National Statistician and Civil Registrar General
TABLE 1-A Value of Production Index, September 2018 and October 2018
(2000 =100)
|
Industry Group |
Year-on-Year Growth (%) |
|
| October 2018 |
September 2018
(revised)
|
|
|
Gainers |
|
|
|
Petroleum products |
53.0 |
42.6 |
|
Electrical machinery |
24.4 |
17.5 |
|
Machinery except electrical |
14.7 |
17.3 |
|
Beverages |
19.8 |
13.9 |
|
Textiles |
49.7 |
51.4 |
|
Miscellaneous manufactures |
36.9 |
21.0 |
|
Transport equipment |
10.1 |
17.5 |
|
Paper and paper products |
16.7 |
17.8 |
|
Tobacco products |
8.7 |
-24.4 |
|
Rubber and plastic products |
5.8 |
-8.4 |
|
Chemical products |
2.0 |
15.7 |
|
Wood and wood products |
11.8 |
-1.0 |
|
Basic Metals |
1.4 |
7.8 |
|
Losers |
|
|
|
Food manufacturing |
-13.2 |
-8.2 |
|
Printing |
-69.2 |
-70.6 |
|
Fabricated metal products |
-30.8 |
-28.2 |
|
Footwear and wearing apparel |
-4.5 |
-11.0 |
|
Furniture and fixtures |
-8.5 |
-4.9 |
|
Leather products |
-12.7 |
-6.6 |
|
Non-metallic mineral products |
-0.7 |
-0.7 |
TABLE 1-B Volume of Production Index, September 2018 and October 2018
(2000 = 100)
|
Industry Group |
Year-on-Year Growth (%) |
|
| October 2018 |
September 2018
(revised)
|
|
|
Gainers |
|
|
|
Petroleum products |
30.8 |
20.3 |
|
Electrical machinery |
16.9 |
8.6 |
|
Machinery except electrical |
17.6 |
18.8 |
|
Textiles |
41.9 |
46.0 |
|
Miscellaneous manufactures |
31.2 |
16.0 |
|
Non-metallic mineral products |
11.9 |
13.1 |
|
Transport equipment |
7.5 |
15.9 |
|
Beverages |
6.1 |
0.1 |
|
Paper and paper products |
10.7 |
10.3 |
|
Rubber and plastic products |
7.3 |
-7.6 |
|
Chemical products |
2.6 |
16.2 |
|
Wood and wood products |
17.1 |
2.8 |
|
Furniture and fixtures |
3.0 |
5.2 |
|
Losers |
|
|
|
Food manufacturing |
-14.9 |
-8.3 |
|
Printing |
-70.5 |
-71.8 |
|
Fabricated metal products |
-30.3 |
-27.5 |
|
Footwear and wearing apparel |
-6.2 |
-12.4 |
|
Tobacco products |
-8.6 |
-50.4 |
|
Basic metals |
-3.5 |
0.4 |
|
Leather products |
-6.4 |
-4.2 |
(2000 =100)
|
Industry Group |
Year-on-Year Growth (%) |
|
| October 2018 |
September 2018
(revised)
|
|
|
Gainers |
|
|
|
Petroleum products |
37.4 |
30.9 |
|
Electrical machinery |
16.3 |
2.2 |
|
Food manufacturing |
13.2 |
5.7 |
|
Tobacco products |
44.6 |
15.9 |
|
Machinery except electrical |
8.8 |
7.7 |
|
Transport equipment |
15.9 |
8.0 |
|
Miscellaneous manufactures |
28.1 |
18.6 |
|
Beverages |
9.8 |
4.0 |
|
Footwear and wearing apparel |
15.0 |
1.4 |
|
Basic metals |
9.1 |
9.4 |
|
Furniture and fixtures |
51.3 |
0.6 |
|
Paper and paper products |
18.2 |
18.4 |
|
Non-metallic mineral products |
7.6 |
-5.8 |
|
Rubber and plastic products |
13.2 |
2.1 |
|
Wood and wood products |
21.2 |
22.0 |
|
Printing |
6.1 |
-4.9 |
|
Losers |
|
|
|
Chemical products |
-16.3 |
-5.9 |
|
Textiles |
-31.4 |
-24.8 |
|
Fabricated metal products |
-13.0 |
-29.3 |
|
Leather products |
-15.3 |
-17.8 |
TABLE 2-B Volume of Net Sales Index, September 2018 and October 2018
(2000 = 100)
|
Industry Group |
Year-on-Year Growth (%) |
|
| October 2018 |
September 2018
(revised)
|
|
|
Gainers |
|
|
|
Food manufacturing |
13.4 |
8.0 |
|
Petroleum products |
16.4 |
9.5 |
|
Electrical machinery |
8.5 |
-6.2 |
|
Machinery except electrical |
8.8 |
6.4 |
|
Transport equipment |
15.8 |
9.0 |
|
Non-metallic mineral products |
20.0 |
6.1 |
|
Furniture and fixtures |
64.6 |
7.6 |
|
Tobacco products |
22.2 |
-23.6 |
|
Footwear and wearing apparel |
13.6 |
0.3 |
|
Miscellaneous manufactures |
16.7 |
8.0 |
|
Paper and paper products |
14.8 |
13.5 |
|
Rubber and plastic products |
17.4 |
5.4 |
|
Basic metals |
4.1 |
2.3 |
|
Wood and wood products |
26.4 |
26.0 |
|
Printing |
1.9 |
-8.7 |
|
Losers |
|
|
|
Chemical products |
-14.7 |
-4.3 |
|
Textiles |
-34.7 |
-27.2 |
|
Beverages |
-4.3 |
-10.0 |
|
Fabricated metal products |
-12.4 |
-28.6 |
|
Leather products |
-9.7 |
-15.3 |