
|
Table A Year-on-Year Growth Rates for Production Index, Net Sales Index and Producer Price Index: March 2019 and March 2018 |
||
|---|---|---|
|
TOTAL MANUFACTURING |
MARCH
2019
|
MARCH
2018
|
|
Production Index (2000=100) |
|
|
|
Value (VaPI) |
-5.4 |
10.5 |
|
Volume (VoPI) |
-9.2 |
11.0 |
|
Net Sales Index (2000=100) |
|
|
|
Value (VaNSI) |
3.2 |
6.5 |
|
Volume (VoNSI) |
-0.9 |
7.0 |
|
Producer Price Index (2000=100) |
4.2r |
-0.6 |
r - revised
- Value of Production Index decrlines in March 2019
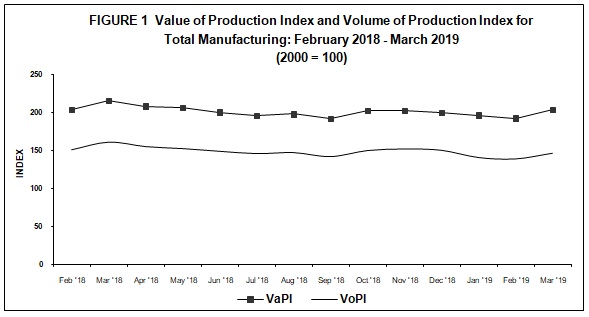
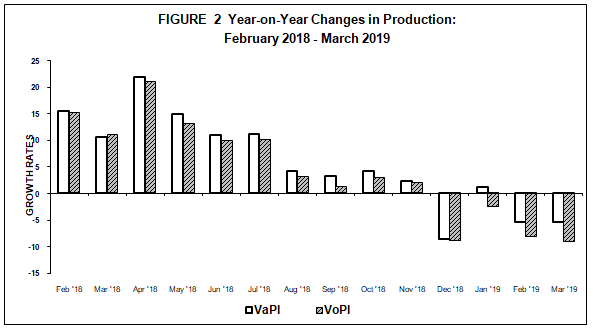
The Value of Production Index (VaPI) decreased at an annual rate of 5.4 percent in March 2019. During the same month of the previous year, VaPI went up at an annual rate of 10.5 percent.
The decline of VaPI in March 2019 can be attributed to the decreases in the indices of three major industry groups led by food manufacturing (-20.3%). Refer to Tables1-A and 1.
- Volume of Production Index decreases
Volume of Production Index (VoPI) also posted a decrease of 9.2 percent in March 2019. During March 2018, an annual two-digit growth of VoPI at 11.0 percent was observed.
Eight major industry groups pulled down the annual VoPI led by furniture and fixtures (-25.5%), food manufacturing (-17.3%) and petroleum products (-17.2%). Refer to Tables 1-B and 2.
- Value of Net Sales Index increases at a slower rate
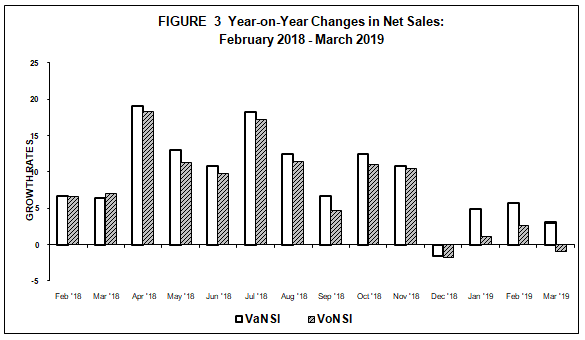
Value of Net Sales Index (VaNSI) continued to exhibit a positive annual growth rate of 3.2 percent in March 2019. Compared with the same period of the previous year, the annual growth was higher at 6.5 percent.
Of the 20 major industry groups, 15 contributed to the rise in VaNSI, in which two-digit annual growth rates were observed in five major industry groups, namely: wood and wood products (46.3%), printing (24.8%), furniture and fixtures (21.9%), transport equipment (20.9%) and beverages (13.8%). Refer to Tables 2-A and 3.
- Volume of Net Sales Index slightly decreases
The Volume of Net Sales Index (VoNSI) declined by 0.9 percent in March 2019 from the annual growth of 7.0 percent during the same period last year.
The slowdown in VoNSI can be attributed to the decreases of ten major industry groups with machinery except electrical posting the highest decline of 28.8 percent followed by furniture and fixtures (-21.3%) and textiles (-11.7%). Refer to Tables 2-B and 4.
- Average Capacity Utilization Rate is highest for petroleum products
Average capacity utilization rate in March 2019 for total manufacturing was recorded at 84.4 percent. Fifty-five percent or 11 of the 20 major industries had at least 80 percent capacity utilization rates. These were:
- petroleum products (89.6%)
- basic metals (88.7%)
- non-metallic mineral products (86.4%)
- machinery except electrical (86.4%)
- food manufacturing (85.3%)
- electrical products (85.0%)
- chemical machinery (85.0%)
- paper and paper products (83.9%)
- rubber and plastic products (83.3%)
- wood and wood products (81.9%)
- textiles (80.4%)
The proportion of establishments that operated at full capacity (90% to 100%) was more than one-fourth (26.5%) of the total number of establishments in March 2019. About 55.3 percent of the total establishments operated at 70 percent to 89 percent capacity while almost one-fifth (18.2%) operated below 70 percent capacity. Refer to Tables B and 6.
|
Table B Distribution of Key Manufacturing Establishments by Capacity Utilization for Total Manufacturing: February 2019 |
|
|---|---|
|
Capacity Utilization |
Percent Share |
|
Below 50% |
3.5 |
|
50% - 59% |
4.5 |
|
60% - 69% |
10.2 |
|
70% - 79% |
21.9 |
|
80% - 89% |
33.4 |
|
90% - 100% |
26.5 |
JOSIE B. PEREZ
Assistant Secretary
Officer-in-Charge
TABLE 1-A Value of Production Index, February 2019 and March 2019
(2000 =100)
|
Industry Group |
Year-on-Year Growth (%) |
|
| March 2019 |
February 2019
(revised)
|
|
|
Gainers |
|
|
|
Footwear and wearing apparel |
27.3 |
31.6 |
|
Transport equipment |
17.5 |
4.4 |
|
Printing |
42.2 |
17.7 |
|
Beverages |
9.6 |
22.2 |
|
Machinery except electrical |
3.4 |
-6.6 |
|
Rubber and plastic products |
10.8 |
9.2 |
|
Paper and paper products |
12.9 |
11.9 |
|
Textiles |
11.9 |
16.0 |
|
Fabricated metal products |
14.0 |
10.9 |
|
Furniture and fixtures |
15.5 |
19.9 |
|
Wood and wood products |
20.0 |
31.7 |
|
Electrical machinery |
0.6 |
-6.6 |
|
Non-metallic mineral products |
2.9 |
4.1 |
|
Miscellaneous manufactures |
3.7 |
14.5 |
|
Chemical products |
0.6 |
4.8 |
|
Tobacco products |
1.1 |
1.6 |
|
Leather products |
1.0 |
1.4 |
|
Losers |
|
|
|
Food manufacturing |
-20.3 |
-21.5 |
|
Petroleum products |
-13.2 |
2/ |
|
Basic Metals |
-9.1 |
-8.6 |
TABLE 1-B Volume of Production Index, February 2019 and March 2019
(2000 = 100)
|
Industry Group |
Year-on-Year Growth (%) |
|
| March 2019 |
February 2019
(revised)
|
|
|
Gainers |
|
|
|
Footwear and wearing apparel |
29.3 |
36.3 |
|
Transport equipment |
13.3 |
1.7 |
|
Chemical products |
6.4 |
10.1 |
|
Printing |
39.0 |
14.0 |
|
Beverages |
6.9 |
19.1 |
|
Machinery except electrical |
2.5 |
-8.3 |
|
Miscellaneous manufactures |
8.9 |
20.2 |
|
Textiles |
8.6 |
11.2 |
|
Paper and paper products |
7.8 |
10.4 |
|
Fabricated metal products |
10.1 |
9.7 |
|
Rubber and plastic products |
5.0 |
2.8 |
|
Wood and wood products |
24.1 |
44.7 |
|
Losers |
|
|
|
Food manufacturing |
-17.3 |
-18.9 |
|
Petroleum products |
-17.2 |
-2.8 |
|
Basic metals |
-4.6 |
-3.6 |
|
Furniture and fixtures |
-25.5 |
-17.5 |
|
Electrical machinery |
-1.0 |
-6.9 |
|
Non-metallic mineral products |
-5.7 |
-5.9 |
|
Tobacco products |
-3.8 |
-3.5 |
|
Leather products |
-1.9 |
7.8 |
(2000 =100)
|
Industry Group |
Year-on-Year Growth (%) |
|
| March 2019 |
February 2019
(revised)
|
|
|
Gainers |
|
|
|
Transport equipment |
20.9 |
8.2 |
|
Beverages |
13.8 |
12.5 |
|
Petroleum products |
2.9 |
4.5 |
|
Basic metals |
7.0 |
5.8 |
|
Printing |
24.8 |
32.8 |
|
Footwear and wearing apparel |
9.4 |
8.0 |
|
Wood and wood products |
46.3 |
51.7 |
|
Chemical products |
2.7 |
5.9 |
|
Furniture and fixtures |
21.9 |
31.2 |
|
Non-metallic mineral products |
5.5 |
5.3 |
|
Tobacco products |
7.5 |
22.4 |
|
Food manufacturing |
0.5 |
7.1 |
|
Fabricated metal products |
3.1 |
4.8 |
|
Rubber and plastic products |
2.2 |
3.5 |
|
Paper and paper products |
0.8 |
-3.3 |
|
Losers |
|
|
|
Machinery except electrical |
-28.2 |
-21.0 |
|
Textiles |
-9.0 |
-8.9 |
|
Electrical machinery |
-0.4 |
9.5 |
|
Miscellaneous manufactures |
-1.6 |
0.4 |
|
Leather products |
-6.7 |
-26.1 |
TABLE 2-B Volume of Net Sales Index, February 2019 and March 2019
(2000 = 100)
|
Industry Group |
Year-on-Year Growth (%) |
|
| March 2019 |
February 2019
(revised)
|
|
|
Gainers |
|
|
|
Chemical products |
8.7 |
11.2 |
|
Transport equipment |
16.7 |
5.4 |
|
Food manufacturing |
4.2 |
10.7 |
|
Basic metals |
12.3 |
11.6 |
|
Beverages |
11.0 |
9.7 |
|
Footwear and wearing apparel |
11.1 |
11.9 |
|
Wood and wood products |
51.3 |
66.6 |
|
Printing |
21.9 |
28.7 |
|
Miscellaneous manufactures |
3.3 |
5.4 |
|
Tobacco products |
2.2 |
16.4 |
|
Losers |
|
|
|
Machinery except electrical |
-28.8 |
-22.4 |
|
Electrical machinery |
-1.9 |
9.2 |
|
Textiles |
-11.7 |
-12.7 |
|
Petroleum products |
-1.9 |
1.6 |
|
Furniture and fixtures |
-21.3 |
-9.8 |
|
Non-metallic mineral products |
-3.3 |
-4.8 |
|
Paper and paper products |
-3.8 |
-4.6 |
|
Rubber and plastic products |
-3.2 |
-2.6 |
|
Leather products |
-8.7 |
-21.5 |
|
Fabricated metal products |
-0.4 |
3.6 |