
Table A Year-on-Year Growth Rates for Production Index, Net Sales Index and Producer Price Index: January 2020 and January 2019 (In Percent) | ||
|---|---|---|
TOTAL MANUFACTURING | JANUARY 2020 | JANUARY 2019 |
| Production Index (2000=100) |
| |
| Value (VaPI) | -6.3 | -0.3 |
| Volume (VoPI) | -1.6 | -4.2 |
| Net Sales Index (2000=100) |
|
|
| Value (VaNSI) | 0.9 | 3.5 |
| Volume (VoNSI) | 5.9 | -0.6 |
| Producer Price Index (2000=100) | -4.8r | 4.1 |
r - revised
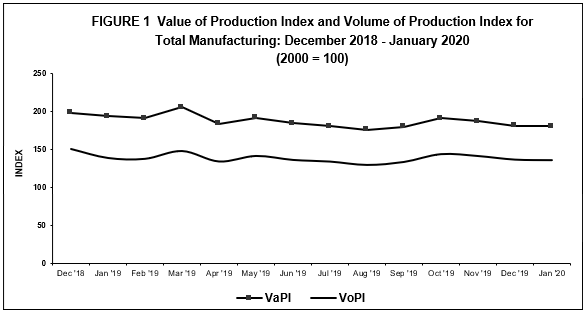
Value of Production Index drops in January 2020
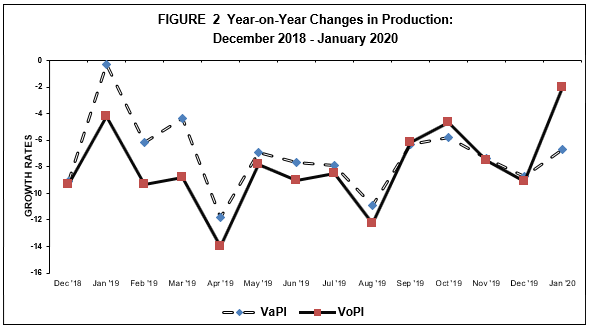
Based on the preliminary results of the Monthly Integrated Survey of Selected Industries (MISSI), the Value of Production Index (VaPI) continued to decline at an annual drop of 6.3 percent in January 2020. During the same month of the previous year, the VaPI posted a slower decrease of 0.3 percent.
Thirteen out of the 20 major industry groups registered annual declines, with two-digit decreases noted in the following major industry groups: wood and wood products (-48.6%), petroleum products (-40.9%), basic metals (-24.9%), miscellaneous manufactures (-24.2%), transport equipment (-17.6%), paper and paper products (-17.3%), textiles (-16.4%), tobacco products (-12.1%) and electrical machinery (-12.0%). Refer to Tables 1 and 1-A.
- Volume of Production Index slips
The Volume of Production Index (VoPI) slipped to 1.6 percent in January 2020, from its annual decrement of 4.2 percent in the same month of the previous year.
The decline in VoPI was due to the decreases in the indices of 11 major industry groups with wood and wood products posting the highest negative rate of 42.6 percent. This was followed by seven other major industries, namely: petroleum products (-39.7%), basic metals (-23.8%), miscellaneous manufactures (-23.2%), tobacco products (-18.3%), paper and paper products (-14.3%), textiles (-11.5%), and furniture and fixtures (-11.3%). Refer to Tables 1-B and 2.
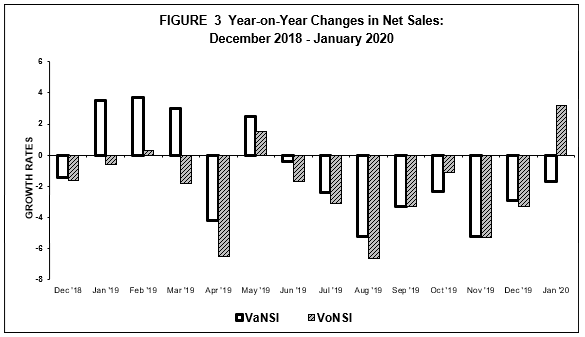
- Value of Net Sales Index increases at a slower rate
The Value of Net Sales Index (VaNSI) exhibited a year-on-year increment of 0.9 percent in January 2020. In the same month of the previous year, the annual growth rate of VaNSI was higher at 3.5 percent.
Of the 20 major industry groups, 11 contributed to the rise in VaNSI, in which two-digit annual growth rates were observed in six major industry groups, namely: printing (26.5%), tobacco products (20.7%), furniture and fixtures (15.1%), beverages (14.3%), footwear and wearing apparel (14.3%) and chemical products (11.2%). Refer to Tables 2-A and 3.
- Volume of Net Sales Index also accelerates
Volume of Net Sales Index (VoNSI) similarly posted a year-on-year increase of 5.9 percent in January 2020. In the same month of the previous year, VoNSI declined at 0.6 percent.
Seven of the 11 major industry groups that mainly influenced the growth in VoNSI were: footwear and wearing apparel (27.6%), fabricated metal products (23.6%), printing (23.6%), chemical products (20.6%), transport equipment (13.5%), tobacco products (12.3%) and beverages (10.8%). Refer to Tables 2-B and 4.
Average Capacity Utilization Rate is highest for petroleum products
Average capacity utilization rate for total manufacturing in January 2020 was posted at 84.4 percent. Twelve of the 20 major industries had at least 80 percent capacity utilization rates during the month. These were:
- petroleum products (90.0%)
- basic metals (88.6%)
- machinery except electrical (86.5%)
- non-metallic mineral products (86.3%)
- food manufacturing (85.5%)
- chemical products (85.1%)
- electrical machinery (84.9%)
- printing (84.0%)
- paper and paper products (83.9%)
- rubber and plastic products (83.2%)
- wood and wood products (82.3%)
- textiles (80.1%)
Refer to Table 6.
More than a quarter of total manufacturing establishments operate at full capacity
The proportion of establishments that operated at full capacity (90% to 100%) was more than a quarter (28.0%) of the total number of establishments for manufacturing in January 2020. More than half (54.1%) operated at 70 percent to 89 percent capacity, while almost one-fifth (17.9%) operated below 70 percent capacity. Refer to Table B.
Table B Distribution of Key Manufacturing Establishments by Capacity Utilization for Total Manufacturing: January 2020 | ||
|---|---|---|
Capacity Utilization | Number of Establishments | Percent Share |
Below 50% | 32 | 3.7 |
50% - 59% | 36 | 4.2 |
60% - 69% | 86 | 10.0 |
70% - 79% | 177 | 20.5 |
80% - 89% | 291 | 33.6 |
90% - 100% | 242 | 28.0 |
CLAIRE DENNIS S. MAPA, Ph. D.
Undersecretary
National Statistician and Civil Registrar General
TABLE 1-A Value of Production Index, December 2019 and January 2020
(2000 =100)
Industry Group | Year-on-Year Growth (%) | |
| January 2020 | December 2019 (revised) | |
| Gainers |
|
|
Machinery except electrical | 20.1 | 14.9 |
Chemical products | 10.9 | 3.1 |
Printing | 41.7 | 52.7 |
Food manufacturing | 1.9 | 2.5 |
Fabricated metal products | 19.5 | 11.9 |
Beverages | 3.4 | 16.9 |
Furniture and fixtures | 5.5 | 12.9 |
| Losers |
|
|
Petroleum products | -40.9 | -48.7 |
Electrical machinery | -12.0 | -4.2 |
Basic Metals | -24.9 | -50.7 |
Transport equipment | -17.6 | -8.0 |
Miscellaneous manufactures | -24.2 | -9.9 |
Paper and paper products | -17.3 | -3.9 |
Textiles | -16.4 | -18.8 |
Wood and wood products | -48.6 | -1.9 |
Tobacco products | -12.1 | 9.6 |
Non-metallic mineral products | -2.1 | 5.2 |
Footwear and wearing apparel | -1.8 | 4.4 |
Rubber and plastic products | -1.0 | 0.9 |
Leather products | -3.3 | 2.4 |
TABLE 1-B Volume of Production Index, December 2019 and January 2020
(2000 = 100)
Industry Group | Year-on-Year Growth (%) | |
| January 2020 | December 2019 (revised) | |
| Gainers |
|
|
Machinery except electrical | 28.1 | 21.6 |
Chemical products | 20.3 | 15.6 |
Fabricated metal products | 38.7 | 27.9 |
Printing | 38.4 | 52.7 |
Food manufacturing | 2.5 | 4.0 |
Footwear and wearing apparel | 9.6 | 18.4 |
Rubber and plastic products | 1.4 | -2.0 |
Leather products | 15.9 | 5.5 |
Beverages | 0.3 | 12.9 |
| Losers |
|
|
Petroleum products | -39.7 | -48.1 |
Electrical machinery | -9.2 | 1.2 |
Basic metals | -23.8 | -48.0 |
Miscellaneous manufactures | -23.2 | -10.5 |
Tobacco products | -18.3 | 5.7 |
Transport equipment | -8.2 | -3.3 |
Paper and paper products | -14.3 | 1/ |
Wood and wood products | -42.6 | 7.7 |
Textiles | -11.5 | -16.4 |
Furniture and fixtures | -11.3 | -30.4 |
Non-metallic mineral products | -0.2 | 2.5 |
(2000 =100)
Industry Group | Year-on-Year Growth (%) | |
| January 2020 | December 2019 (revised) | |
| Gainers |
|
|
Chemical products | 11.2 | 10.1 |
Food manufacturing | 4.8 | -11.1 |
Beverages | 14.3 | 22.9 |
Footwear and wearing apparel | 14.3 | -13.3 |
Tobacco products | 20.7 | 33.5 |
Printing | 26.5 | 24.2 |
Petroleum products | 1.9 | -3.2 |
Furniture and fixtures | 15.1 | 13.2 |
Fabricated metal products | 6.6 | 30.7 |
Transport equipment | 1.9 | 5.1 |
Rubber and plastic products | 6.2 | 4.9 |
| Losers |
|
|
Basic metals | -25.5 | -30.9 |
Machinery except electrical | -7.3 | -21.5 |
Textiles | -16.9 | -13.8 |
Electrical machinery | -1.5 | -2.4 |
Miscellaneous manufactures | -10.5 | -0.3 |
Non-metallic mineral products | -6.7 | -3.4 |
Paper and paper products | -7.9 | -4.6 |
Leather products | -37.7 | -13.2 |
Wood and wood products | -15.8 | -7.7 |
TABLE 2-B Volume of Net Sales Index, December 2019 and January 2020
(2000 = 100)
Industry Group | Year-on-Year Growth (%) | |
| January 2020 | December 2019 (revised) | |
| Gainers |
|
|
Chemical products | 20.6 | 23.5 |
Food manufacturing | 5.4 | -9.8 |
Footwear and wearing apparel | 27.6 | -1.7 |
Transport equipment | 13.5 | 10.5 |
Beverages | 10.8 | 18.7 |
Petroleum products | 4.0 | -1.9 |
Fabricated metal products | 23.6 | 49.3 |
Electrical machinery | 1.6 | 3.1 |
Printing | 23.6 | 24.2 |
Tobacco products | 12.3 | 28.7 |
Rubber and plastic products | 8.9 | 1.9 |
| Losers |
|
|
Basic metals | -24.4 | -27.1 |
Textiles | -12.0 | -11.3 |
Miscellaneous manufactures | -9.3 | -1.0 |
Non-metallic mineral products | -4.8 | -5.9 |
Machinery except electrical | -1.1 | -16.8 |
Paper and paper products | -4.5 | -0.7 |
Leather products | -25.5 | -10.3 |
Wood and wood products | -5.9 | 1.4 |
Furniture and fixtures | -3.2 | -30.2 |