
Table A Year-on-Year Growth Rates for Production Index, Net Sales Index
and Producer Price Index
February-January 2020 and February 2019
(In Percent)
|
TOTAL MANUFACTURING |
FEBRUARY
2020
|
JANUARY
2020
|
FEBRUARY 2019 |
|
Production Index (2000=100) |
|
|
|
|
Value (VaPI) |
-1.8 |
-5.2r |
-6.2 |
|
Volume (VoPI) |
3.0 |
0.1r |
-9.3 |
|
Net Sales Index (2000=100) |
|
|
|
|
Value (VaNSI) |
3.1 |
3.2r |
3.7 |
|
Volume (VoNSI) |
8.2 |
9.0r |
0.3 |
|
Producer Price Index (2000=100) |
-4.7r |
-5.3r |
3.4 |
r - revised
1. Production
- Value of Production Index decreases at a slower pace
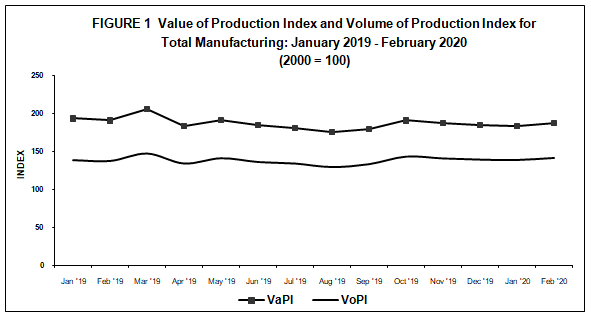
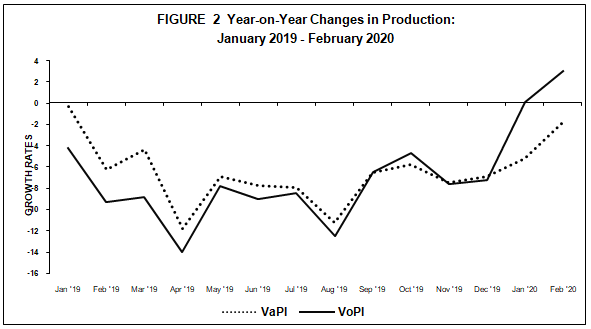
Based on the preliminary results of the Monthly Integrated Survey of Selected Industries (MISSI), Value of Production Index (VaPI) for Manufacturing sector dropped at an annual rate of 1.8 percent in February 2020. This decline was slower than the recorded decreases in the previous month at annual rate of 5.2 percent and in February of the previous year at 6.2 percent. (Table A)
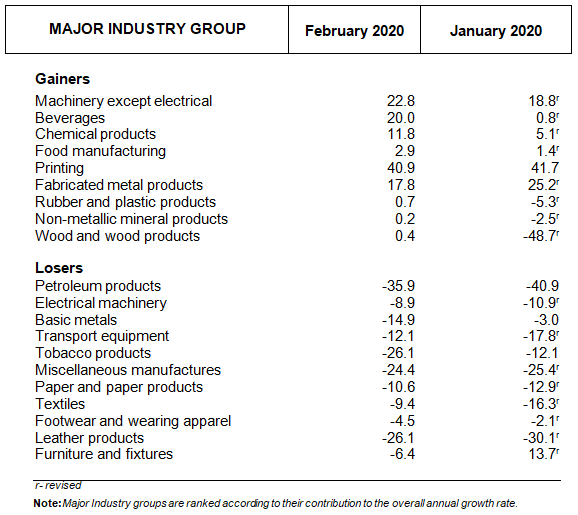
Eleven of the 20 major industry groups pulled down the VaPI with the following major industry groups largely contributing to the decline: petroleum products (-35.9%), tobacco products (-26.1%), leather products (-26.1%), miscellaneous manufactures (-24.4%), basic metals (-14.9%), transport equipment (-12.1%), and paper and paper products (-10.6%). (Tables 1 and 1-A)
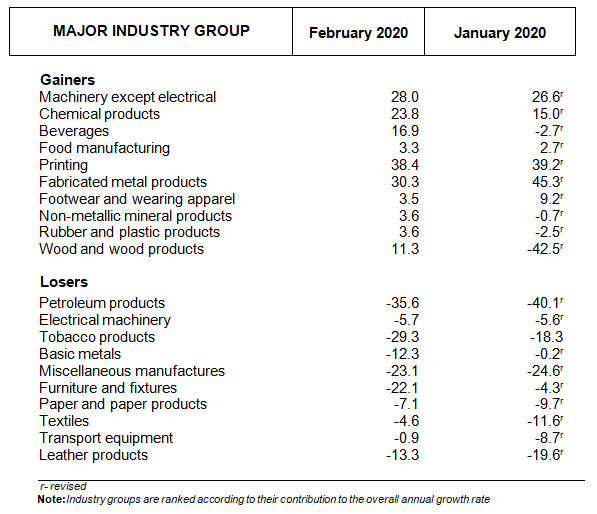
- Volume of Production Index rebounds from previous year’s level
The Volume of Production Index (VoPI) made a turnaround as it grew by 3.0 percent in February 2020, from -9.3 percent annual growth in the same month a year ago. In the previous month, VoPI grew by 0.1 percent annually. (Table A)
Ten major industry groups exhibited increases with printing (38.4%), fabricated metal products (30.3%), machinery except electrical (28.0%), chemical products (23.8%), beverages (16.9%), and wood and wood products (11.3%) recording two-digit annual growhts. (Tables1-B and 2)
2. Net Sales
- Value of Net Sales Index sustains growth
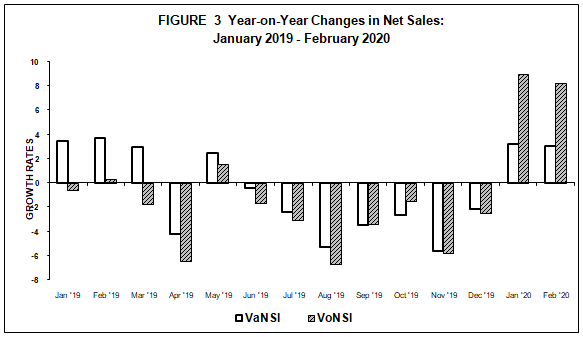
The Value of Net Sales Index (VaNSI) reflected a year-on-year increase of 3.1 percent in February 2020, slightly slower than its annual growth in the previous month of 3.2 percent. In February 2019, VaNSI grew at a faster pace of 3.7 percent. (Table A)
The uptrend in VaNSI was brought about by the increments in 11 major industry groups with two-digit increases noted in the following: tobacco products (30.6%), printing (30.2%), beverages (21.7%), machinery except electrical (20.3%), and chemical products (17.2%). (Tables 2-A and 3)
- Volume of Net Sales Index picks up
Year-on-year, the Volume of Net Sales Index (VoNSI) showed an uptick of 8.2 percent in February 2020, lower than the growth in the previous month of 9.0 percent. During the same month of the previous year, VoNSI increased at a slower pace of 0.3 percent. (Table A)
Fourteen of the major industry groups contributed to the positive growth of VoNSI, eight of which had two-digit annual growth rates as follows: chemical products (29.8%), printing (27.9%), machinery except electrical (25.4%), tobacco products (24.7%), fabricated metal products (19.9%), beverages (18.5%), transport equipment (12.6%), and footwear and wearing apparel (11.5%). (Tables 2-B and 4)
- Average Capacity Utilization Rate is highest for petroleum products
Average capacity utilization rate for total manufacturing in February 2020 was posted at 84.6 percent. Twelve of the 20 major industries had at least 80 percent capacity utilization rates during the month. These were:
- petroleum products (90.0%)
- basic metals (88.8%)
- machinery except electrical (86.7%)
- non-metallic mineral products (86.2%)
- food manufacturing (85.5%)
- chemical products (85.3%)
- electrical machinery (84.9%)
- printing(84.1%)
- paper and paper products (83.9%)
- rubber and plastic products (83.2%)
- wood and wood products (82.3%)
- textiles (80.4%)
Refer to Table 6.
- More than a quarter of total manufacturing establishments operate at full capacity
The proportion of establishments that operated at full capacity (90% to 100%) was more than a quarter (27.9%) of the total number of establishments for manufacturing. More than half (54.4%) operated at 70 to 89 percent capacity while almost one-fifth (17.7%) operated below 70 percent capacity. (Table B)
Table B Distribution of Key Manufacturing Establishments by Capacity Utilization
for Total Manufacturing: February 2020
|
Capacity Utilization |
Number of Establishments |
Percent Share |
|
Below 50% |
33 |
3.8 |
|
50% - 59% |
36 |
4.2 |
|
60% - 69% |
85 |
9.7 |
|
70% - 79% |
185 |
21.2 |
|
80% - 89% |
290 |
33.2 |
|
90% - 100% |
243 |
27.9 |
(Sgd.) CLAIRE DENNIS S. MAPA, Ph. D.
Undersecretary
National Statistician and Civil Registrar General
by Major Industry Group
January 2020 and February 2020
(2000 =100)
by Major Industry Group
January 2020 and February 2020
(2000 = 100)
by Major Industry Group
January 2020 and February 2020
(2000 =100)
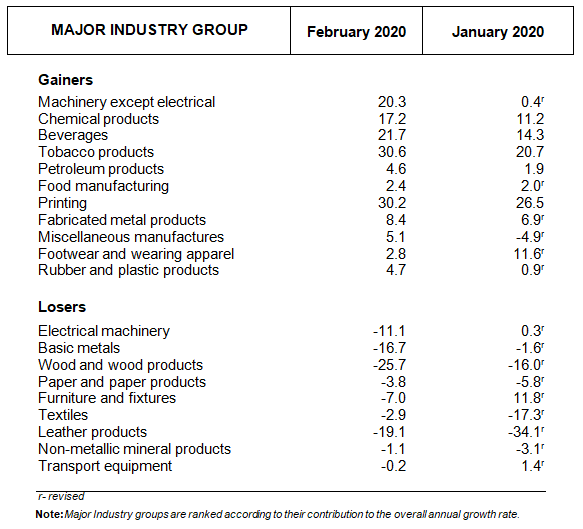
TABLE 2-B Year-on-Year Growth Rate (%) of Volume of Net Sales Index
by Industry Group
January 2020 and February 2020
(2000 = 100)
