
|
Table A Year-on-Year Growth Rates for Production Index, Net Sales Index and Producer Price Index: December 2018 and December 2017 |
||
|---|---|---|
|
TOTAL MANUFACTURING |
DECEMBER
2018
|
DECEMBER
2017
|
|
Production Index (2000=100) |
|
|
|
Value (VaPI) |
-9.3 |
-7.1 |
|
Volume (VoPI) |
-10.1 |
-6.1 |
|
Net Sales Index (2000=100) |
|
|
|
Value (VaNSI) |
0.4 |
-10.9 |
|
Volume (VoNSI) |
-0.4 |
-9.9 |
|
Producer Price Index (2000=100) |
0.8r |
-1.1 |
r - revised
- Value of Production Index contracts in December 2018
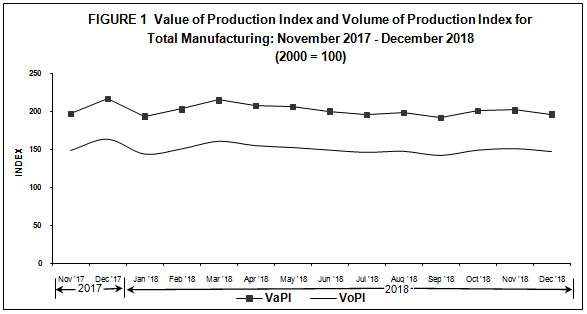
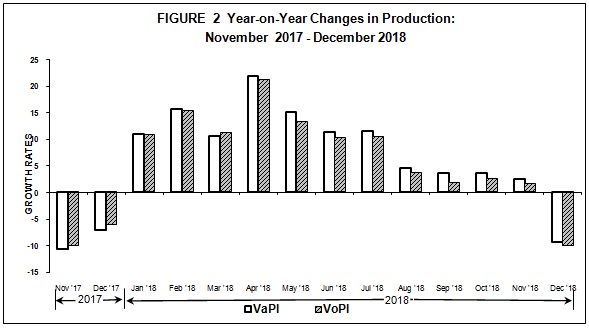
The Value of Production Index (VaPI) for manufacturing further showed an annual drop of 9.3 percent in December 2018. In the same month of the previous year, VaPI also went down by 7.1 percent.
Printing, with a 78.5 percent decrement, contributed largely to the decrease of VaPI in December 2018. This was followed by four other major industries that registered two-digit decrements in VaPI, namely: chemical products (-28.2%), basic metals (-16.5%), food manufacturing (-15.8%) and tobacco products (-11.1%). Refer to Tables1-A and 1.
- Volume of Production Index further declines
Volume of Production Index (VoPI) continued to move downward as it posted a decrease of 10.1 percent in December 2018. Likewise, VoPI reported a decline of 6.1 percent in comparison with the figure in the same month of 2017.
Ten out of the 20 industry group registered annual declines, with two-digit decreases noted in the following major industry group: printing (-79.4%), chemical products (-28.9%), tobacco products (-22.1%), food manufacturing (-17.8%), basic metals (-16.7%) and machinery except electrical (-12.6%). Refer to Tables 1-B and 2.
- Value of Net Sales Index rebounds
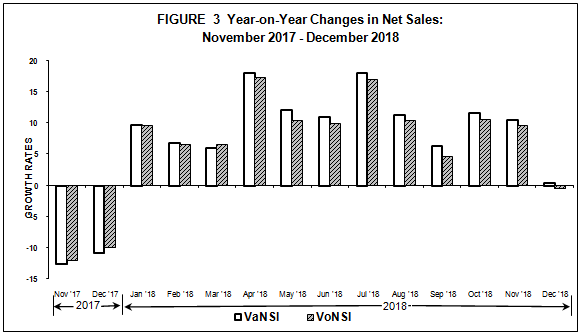
The Value of Net Sales Index (VaNSI) depicted an annual growth of 0.4 percent in December 2018 from a decline of 10.9 percent in the same month of the previous year.
The increment was mainly due to the improved performance in VaNSI of 13 major industry groups, with two-digit increases reported by the following: wood and wood products (29.3%), non-metallic mineral products (21.7%), tobacco products (17.1%), paper and paper products (16.9%), food manufacturing (13.6%), petroleum products (11.2%) and fabricated metal products (10.8%). Refer to Tables 2-A and 3.
- Volume of Net Sales Index decreases at a slower pace
The Volume of Net Sales Index (VoNSI) slipped to 0.4 percent in December 2018, from a decline of 9.9 percent in December 2017.
Eight out of the 20 major industry groups registered annual declines, with two-digit decreases noted in the following major industry groups: textiles (-35.3%), chemical products (-32.0%), leather products (-23.1%) and printing (-14.4%). Refer to Tables 2-B and 4.
- Average Capacity Utilization Rate is highest for petroleum products
Average capacity utilization rate in December 2018 for total manufacturing was recorded at 84.3 percent. Fifty-five percent or 11 of the 20 major industries operated at least 80 percent capacity utilization rates. These were:
- petroleum products (89.8%)
- basic metals (88.9%)
- machinery except electrical (85.9%)
- non-metallic mineral products (86.4%)
- chemical products (85.4%)
- food manufacturing (85.3%)
- electrical machinery (84.9%)
- paper and paper products (83.7%)
- rubber and plastic products (83.2%)
- wood and wood products (82.2%)
- textiles (80.2%)
The proportion of establishments that operated at full capacity (90% to 100%) was more than one-fourth (28.3%) of the total number of establishments in December 2018. About 53.5 percent of the total establishments operated at 70 percent to 89 percent capacity while almost one-fifth (18.2%) operated below 70 percent capacity. Refer to Tables B and 6.
|
Table B Distribution of Key Manufacturing Establishments by Capacity Utilization for Total Manufacturing: December 2018 |
|
|---|---|
|
Capacity Utilization |
Percent Share |
|
Below 50% |
3.4 |
|
50% - 59% |
4.3 |
|
60% - 69% |
10.5 |
|
70% - 79% |
20.5 |
|
80% - 89% |
33.0 |
|
90% - 100% |
28.3 |
LISA GRACE S. BERSALES, Ph. D.
Undersecretary
National Statistician and Civil Registrar General
TABLE 1-A Value of Production Index, November 2018 and December 2018
(2000 =100)
|
Industry Group |
Year-on-Year Growth (%) |
|
| December 2018 |
November 2018
(revised)
|
|
|
Gainers |
|
|
|
Petroleum products |
16.3 |
35.7 |
|
Electrical machinery |
5.8 |
19.0 |
|
Textiles |
57.0 |
53.7 |
|
Beverages |
19.0 |
25.0 |
|
Non-metallic mineral products |
10.8 |
6.9 |
|
Paper and paper products |
9.7 |
21.2 |
|
Rubber and plastic products |
5.2 |
-0.2 |
|
Footwear and wearing apparel |
3.5 |
-6.5 |
|
Wood and wood products |
12.3 |
2.4 |
|
Leather products |
12.3 |
-8.6 |
|
Miscellaneous manufactures |
1.2 |
25.2 |
|
Losers |
|
|
|
Food manufacturing |
-15.8 |
-12.3 |
|
Chemical products |
-28.2 |
-2.7 |
|
Printing |
-78.5 |
-72.2 |
|
Basic Metals |
-16.5 |
3.6 |
|
Machinery except electrical |
-4.1 |
-7.5 |
|
Transport equipment |
-6.6 |
4.0 |
|
Tobacco products |
-11.1 |
34.8 |
|
Fabricated metal products |
-8.5 |
-0.3 |
|
Furniture and fixtures |
-9.8 |
3.9 |
TABLE 1-B Volume of Production Index, November 2018 and December 2018
(2000 = 100)
|
Industry Group |
Year-on-Year Growth (%) |
|
| December 2018 |
November 2018
(revised)
|
|
|
Gainers |
|
|
|
Textiles |
49.7 |
43.4 |
|
Petroleum products |
7.4 |
21.3 |
|
Beverages |
5.8 |
11.3 |
|
Rubber and plastic products |
5.8 |
0.5 |
|
Miscellaneous manufactures |
6.4 |
34.2 |
|
Non-metallic mineral products |
3.5 |
0.4 |
|
Wood and wood products |
18.6 |
6.2 |
|
Leather products |
35.1 |
-2.5 |
|
Paper and paper products |
2.2 |
15.6 |
|
Furniture and fixtures |
0.4 |
16.6 |
|
Losers |
|
|
|
Food manufacturing |
-17.8 |
-14.2 |
|
Chemical products |
-28.9 |
-2.6 |
|
Machinery except electrical |
-12.6 |
-14.0 |
|
Printing |
-79.4 |
-73.3 |
|
Basic metals |
-16.7 |
-0.9 |
|
Tobacco products |
-22.1 |
12.3 |
|
Transport equipment |
-8.2 |
2.0 |
|
Electrical machinery |
-0.9 |
12.0 |
|
Fabricated metal products |
-9.5 |
-0.5 |
|
Footwear and wearing apparel |
-0.3 |
-8.3 |
(2000 =100)
|
Industry Group |
Year-on-Year Growth (%) |
|
| December 2018 |
November 2018
(revised)
|
|
|
Gainers |
|
|
|
Food manufacturing |
13.6 |
15.2 |
|
Electrical machinery |
9.5 |
17.4 |
|
Petroleum products |
11.2 |
19.9 |
|
Machinery except electrical |
7.3 |
8.3 |
|
Non-metallic mineral products |
21.7 |
6.7 |
|
Paper and paper products |
16.9 |
19.6 |
|
Beverages |
5.2 |
18.9 |
|
Footwear and wearing apparel |
5.3 |
3.6 |
|
Wood and wood products |
29.3 |
11.1 |
|
Fabricated metal products |
10.8 |
2.0 |
|
Rubber and plastic products |
6.6 |
6.7 |
|
Miscellaneous manufactures |
1.3 |
18.5 |
|
Tobacco products |
17.1 |
3.9 |
|
Losers |
|
|
|
Chemical products |
-32.2 |
8.3 |
|
Textiles |
-32.4 |
-36.8 |
|
Basic metals |
-3.0 |
-5.9 |
|
Printing |
-10.7 |
-3.3 |
|
Leather products |
-35.9 |
-43.7 |
|
Furniture and fixtures |
-6.4 |
10.3 |
|
Transport equipment |
-0.9 |
4.4 |
TABLE 2-B Volume of Net Sales Index, November 2018 and December 2018
(2000 = 100)
|
Industry Group |
Year-on-Year Growth (%) |
|
| December 2018 |
November 2018
(revised)
|
|
|
Gainers |
|
|
|
Food manufacturing |
13.4 |
15.1 |
|
Non-metallic mineral products |
12.5 |
-1.0 |
|
Electrical machinery |
1.7 |
9.7 |
|
Paper and paper products |
11.5 |
16.8 |
|
Petroleum products |
1.8 |
6.2 |
|
Wood and wood products |
35.8 |
14.7 |
|
Fabricated metal products |
9.7 |
1.8 |
|
Rubber and plastic products |
9.8 |
10.0 |
|
Tobacco products |
3.0 |
-13.2 |
|
Footwear and wearing apparel |
1.9 |
2.0 |
|
Miscellaneous manufactures |
1.3 |
20.7 |
|
Furniture and fixtures |
0.7 |
19.8 |
|
Losers |
|
|
|
Chemical products |
-32.0 |
9.6 |
|
Textiles |
-35.3 |
-40.8 |
|
Machinery except electrical |
-4.6 |
-1.9 |
|
Beverages |
-7.9 |
4.2 |
|
Printing |
-14.4 |
-7.3 |
|
Basic metals |
-2.9 |
-9.7 |
|
Leather products |
-23.1 |
-40.2 |
|
Transport equipment |
-0.4 |
4.8 |