
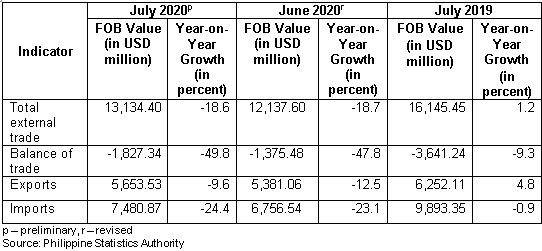
Table A. Summary of External Trade Performance
July 2020, June 2020 and July 2019
A. TOTAL EXTERNAL TRADE AND BALANCE OF TRADE
1. Total external trade continues to contract
The country’s total external trade in goods in July 2020, which amounted to USD 13.13 billion, declined at an annual rate of 18.6 percent. This was slightly lower than its previous month’s annual drop of 18.7 percent. On the other hand, external trade performance increased at an annual rate of 1.2 percent in July 2019. (Table A)
Of the total external trade in July 2020, 57.0 percent were imported goods and the rest were exported goods.
2. Trade deficit drops at a slower rate
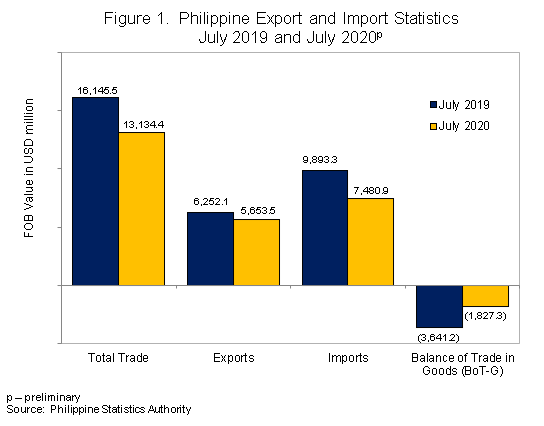
Balance of trade in goods (BoT-G) is the difference between the value of export and import. BoT-G in July 2020 amounted to USD -1.83 billion, representing a trade deficit with an annual decline of percent. The annual drop in trade deficit during the period was faster than the year-on-year decline in the previous month of 47.8 percent and in July a year ago of 9.3 percent. (Figure 1 and Table A)
B. EXPORTS
1. Sales from export drop at a slower rate
The country’s total export sales in July 2020, amounting to USD 5.65 billion, continued to shrink but at a slower rate of 9.6 percent, from 12.5 percent drop a month ago. In July 2019, export performance gained at a rate of 4.8 percent. (Figure 1 and Table A)
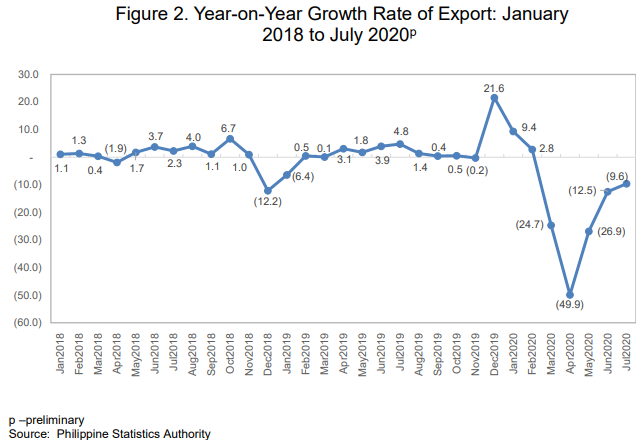
The export earnings in July 2020 marked the fifth month in a row in which value of export contracted but the annual drop continued to weaken as it posted its third consecutive month of slower decline during the period. (Figure 2)
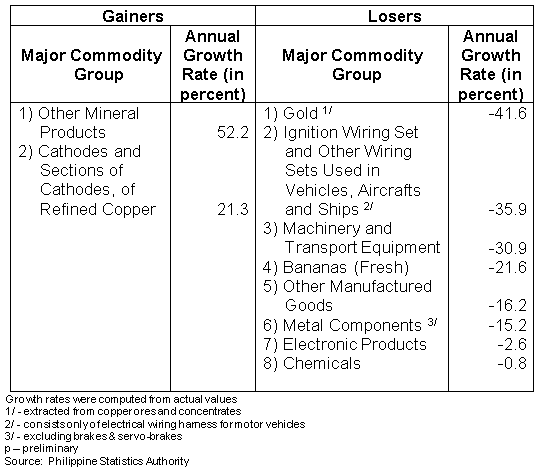
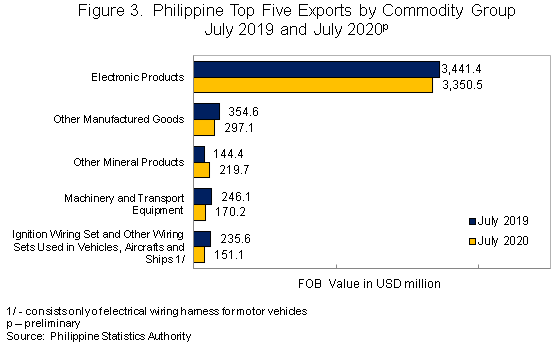
Of the top 10 major commodity groups in terms of exported value, eight had annual decline which was led by gold (-41.6%); ignition wiring set and other wiring sets used in vehicles, aircrafts and ships (-35.9%); and machinery and transport equipment (-30.9%). (Table B and Table 3)
Table B. Top 10 Philippine Exports to All Trading Partners, July 2020p
2.Year-to-date total export drops
The cumulative export earnings from January to July 2020 amounted to USD 34.13 billion, lower by 16.4 percent than the export value earned from January to July 2019. (Table 4)
3. Electronic products commodity group remains the highest on export sales
By commodity group, exports of electronic products continued to be the country’s top export with total earnings of USD 3.35 billion. This amount accounted for 59.3 percent of the total exports in July 2020. This was followed by other manufactured goods with an export value of USD 297.09 million and other mineral products which amounted to USD 219.74 million.(Figure 3 and Table 3)
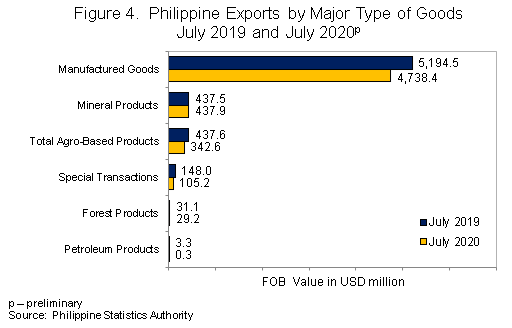
4. Manufactured goods still comprise the biggest chunk of total exports
By major type of goods, exports of manufactured goods shared the highest to total exports in July 2020 amounting to USD 4.74 billion (83.8%). This was followed by mineral products with a share of USD 437.85 million (7.7%) and total agro-based products which shared USD 342.58 million (6.1%). (Figure 4 and Table 5)
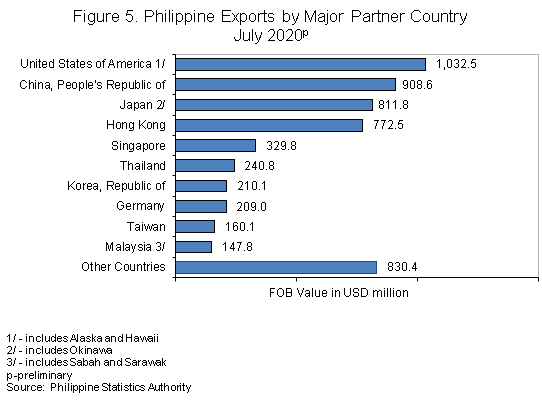
5. United States of America contributes the highest export value
By major trading partner, exports to United States of America (USA) comprised the highest export value amounting to USD 1.03 billion (18.3%) during the month.
Completing the top five major export trading partners were People’s Republic of China with export value of USD 908.61 million (16.1%); Japan, USD 811.84 million (14.4%); Hong Kong, USD 772.49 million (13.7%); and Singapore, USD 329.82 million (5.8%). (Figure 5 and Table 7)
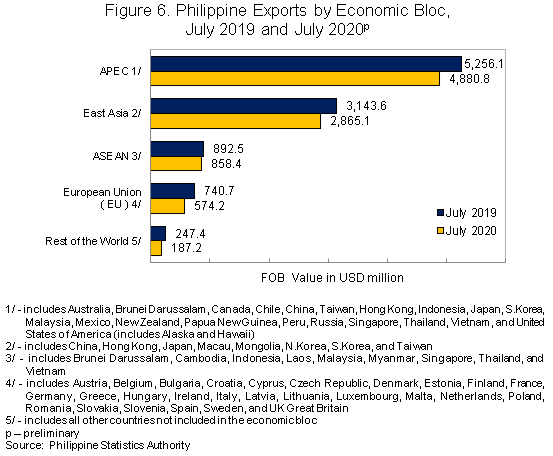
6. Majority of exports are for APEC countries
By economic bloc, USD 4.88 billion (86.3%) of the country’s merchandise exports in July 2020 went to Asia-Pacific Economic Cooperation (APEC) member countries. This was followed by East Asia, valued at USD 2.87 billion (50.7%) and Association of Southeast Asian Nations (ASEAN), which amounted to USD 858.36 million (15.2%). (Figure 6 and Table 8)
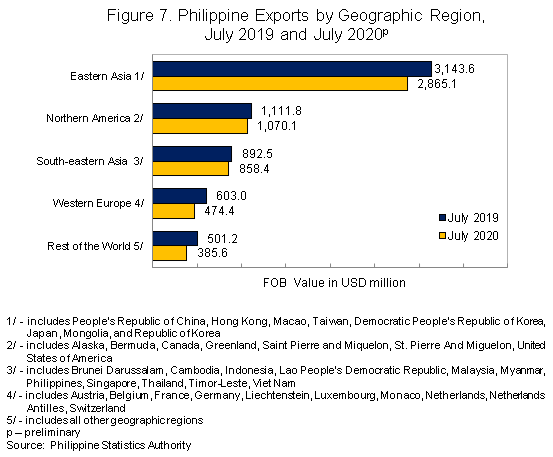
7. Eastern Asia contributes the highest export value by geographic region
By geographic region, Eastern Asia comprised the highest export value amounting to USD 2.87 billion in July 2020. This was followed by Northern America with export value of USD 1.07 billion and South-eastern Asia, USD 858.39 million. (Figure 7)
C. IMPORTS
1. Import value continues to drop
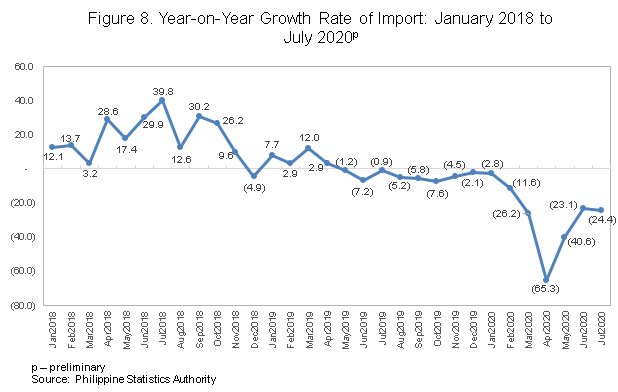
Total imported goods in July 2020, which amounted to USD 7.48 billion, remained at downtrend with an annual rate of 24.4 percent. (Figure 1 and Table A)
Value of imports contracted for the 15th straight month in July 2020. In the previous month, the decline was slower at 23.1 percent, while in July 2019, imports decreased by 0.9 percent annually. (Figure 8)
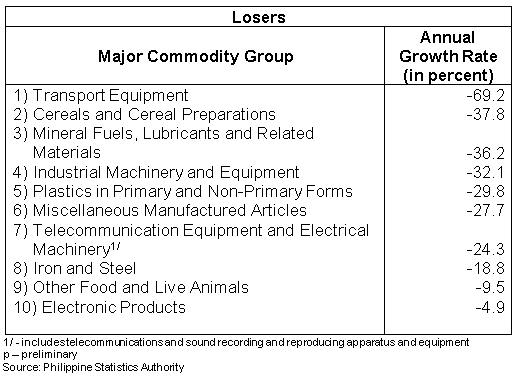
The annual decrement of imported goods in July 2020 was due to the year-on-year decreases in all of the top 10 major import commodities which was led by transport equipment (-69.2%); cereals and cereal preparations (-37.8%); and mineral fuels, lubricants andrelatedmaterials (-36.2%). (Table C and Table 9)
Table C. Top 10 Philippine Imports from All Trading Partners,
July 2020p
Year-on-Year Growth
2. Year-to-date total import value also drops
The cumulative import value from January to July 2020 amounted to USD 46.64 billion, representing a decline of 28.1 percent compared with the import value posted in the same period of 2019. (Table 10)
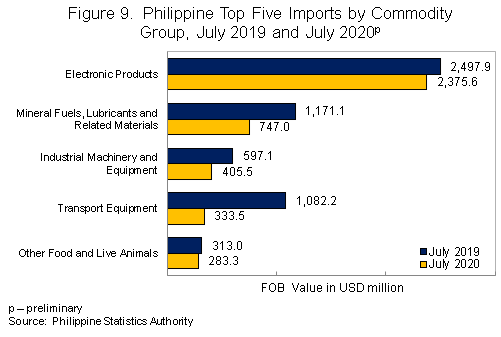
3. Electronic products account for the highest import value among commodity groups
Among the imported commodity groups, electronic products, valued at USD 2.38 billion, contributed the highest share of 31.8 percent to the total imports in July 2020. This was followed by mineral fuels, lubricants and related materials with an import value of USD 746.96 million and industrial machinery and equipment which amounted to USD 405.53 million. (Figure 9 and Table 9)
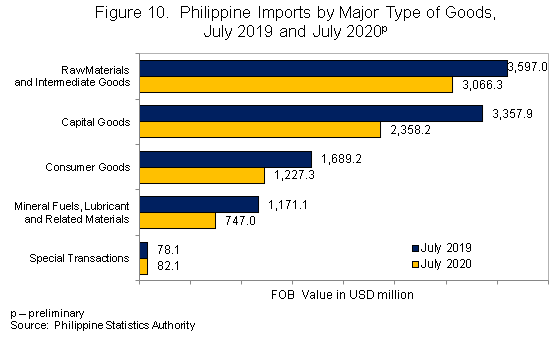
4. Imports of raw materials and intermediate goods contribute the highest
By major type of goods, imports of raw materials and intermediate goods accounted for the largest share of USD 3.07 billion (41.0%) to total import in July 2020. Imports of capital goods, which shared USD 2.36 billion (31.5%), ranked second, followed by consumer goods with a share of USD 1.23 billion (16.4%). (Figure 10 and Table 11)
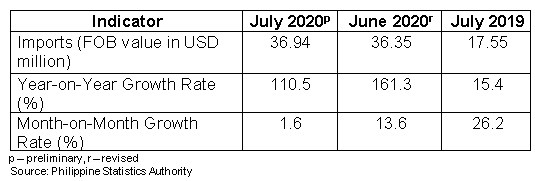
5. Import value of Personal Protective Equipment (PPE) and medical supplies remain on uptrend
The total import value for Personal Protective Equipment (PPE) and medical supplies in July 2020 soared to USD 36.94 million, indicating an annual increment of 110.5 percent or twice the import value for the items in the same month of the previous year. Annual growth of import value for these medical items in the previous month was higher at 161.3 percent. In July 2019, annual increase of the import value for the items was far lower at 15.4 percent. (Table D)
The annual increments noted in the following PPEs and medical supplies pushed up the total import value for these items during the period:
a. protective clothing (1,419.1%);
b. surgical facemask (838.3%);
c. other facemask (109.9%);
d.test kits (73.8); and
e. face shield (51.8%).
Month-on-month, import value for PPEs and medical supplies also rose by 1.6 percent in July 2020, however, at a slower rate than the 13.6 percent monthly increase registered in June 2020. (Table D)
Contributing to the monthly increase in the import value of PPEs and medical supplies were surgical gloves (82.0%) and test kits (49.8%). It was however observed that import values for the following commodities dropped month-on-month in July 2020:
a.headgear (-56.7%);
b. surgical facemask (-53.4%);
c. other facemask (-47.8%);
d. protective clothing (-33.3%); and
e. face shield (-4.9%).
Table D. Philippine Imports of Personal Protective Equipment and Medical Supplies:
July 2020, June 2020 and July 2019
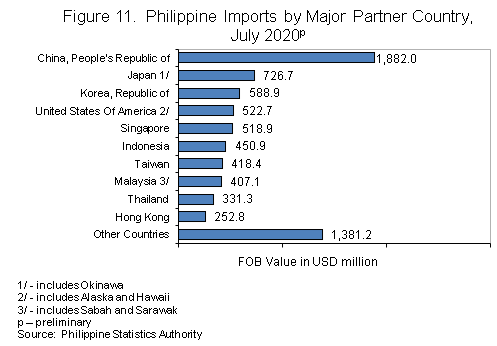
6. People’s Republic of China has the highest import value
The People’s Republic of China was the country’s biggest supplier of imported goods with 25.2 percent share to the total imports in July 2020. Import value from this country amounted to USD 1.88 billion during the month, from USD 2.30 billion in July 2019.
Completing the top five major import trading partners were Japan with import value of USD 726.65 million (9.7%); Republic of Korea, USD 588.92 million (7.9%); USA, USD 522.66 million (7.0%); and Singapore, USD 518.86 million (6.9%). (Figure 11 and Table 13)
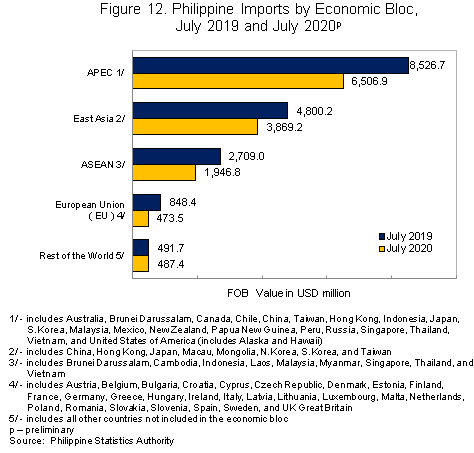
7. Imports come largely from APEC member countries
By economic bloc, APEC member countries were the biggest supplier of the country’s imported goods in July 2020 with a value of USD 6.51 billion (87.0%). This was followed by East Asia with import value of USD 3.87 billion (51.7%) and ASEAN, USD 1.95 billion (26.0%). (Figure 12 and Table 14)
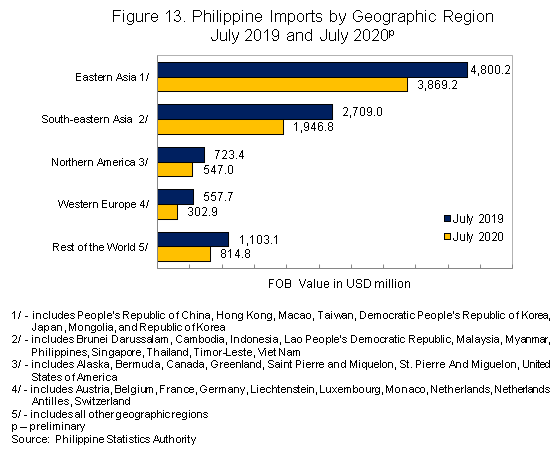
8. Eastern Asia contributes the highest import value by geographic region
By geographic region, USD 3.87 billion of the country’s imports in July 2020 went to Eastern Asia. This was followed by South-eastern Asia, which amounted to USD 1.95 billion and Northern America, which valued to USD 547.05 million. (Figure 13)
DENNIS S. MAPA, Ph.D.
Undersecretary
National Statistician and Civil Registrar General
Explanatory Notes
Export and import trade statistics are compiled by the Philippine Statistics Authority (PSA) from export and import documents submitted to the Bureau of Customs (BOC) by exporters and importers or their authorized representatives as required by law. The PSA regularly collects the following documents:
1. Export Declaration (ED – DTI form);
2. Import Entry and Internal Revenue Declaration(BOC IEIRD Form 236);
3. Informal Import Declaration and Entry (BOC Form 177); and
4. Single Administrative Documents (SAD)
The digitized copies of all documents are provided by BOC and PEZA to PSA on a monthly basis through email.
The output of the Automated Export Documentation System (AEDS) of the BOC is being utilized to generate export statistics. AEDS is a paperless transaction in lieu of the manual filling up of export documents.
Moreover, an electronic copy of the IEIRD, or SAD, is utilized to capture the monthly import figures. SAD-IEIRD is an on-line submission of import documents either by brokers or companies. These are transactions that pass through the Automated Cargo Operating System (ACOS), now called the e2m (electronic to mobile) customs system, which is implemented through the BOC e-Customs Project.
All documents (hard copies and e-files) received within the cut-off date, which is every 30th day of the month, are compiled, processed, summarized, analyzed, and disseminated through monthly statistical tables and press releases. Processing includes coding, editing, review, and validation of results. All documents received after the cut-off date are included in the generation of the revised monthly statistical tables which are available 10 to 15 working days after the press release date.
The press release for a reference month is every 40th day after the reference month. However, if the 40th day falls on a Saturday, the release is made a day earlier (Friday). If it falls on a Sunday or Monday, the release is on Tuesday. Moreover, If the release date falls on a holiday, the date of release is moved accordingly.
The 2015 Philippine Standard Commodity Classification (PSCC) is used to classify the commodities at 10-digit code level for statistical purposes.
Data requests on international merchandise trade statistics can be made at the PSA, Economic Sector Statistics Service, Trade Statistics Division (telephone number: (02) 8376-1975 or at email address, j.soliven@psa.gov.ph).
| Attachment | Size |
|---|---|
|
|
554.1 KB |
|
|
121.21 KB |
|
|
268.56 KB |