
HIGHLIGHTS OF THE PHILIPPINE EXPORT AND IMPORT STATISTICS
DECEMBER 2017 (Preliminary)
| Exports | Imports | ||
December 2017 p | December 2016 r | December 2017 p | December 2016 r | |
| TOTAL |
|
|
|
|
| FOB Value (in Million US Dollars) | 4,721.11 | 4,965.05 | 8,737.67 | 7,432.67 |
| Year-on-Year Growth (Percent) | -4.9 | 6.6 | 17.6 | 19.0 |
| Electronic Products |
|
|
|
|
| FOB Value (in Million US Dollars) | 2,859.00 | 2,485.40 | 2,153.49 | 1,790.48 |
| Year-on-Year Growth (Percent) | 15.0 | -1.5 | 20.3 | 7.5 |
Top 10 Philippine Exports to All Countries: December 2017 p (Year-on-Year Growth in Percent) | |||
|---|---|---|---|
Gainers | Losers | ||
Cathodes and Sections of Cathodes, of Refined Copper | a/ | Coconut Oil | -56.7 |
Gold | 198.8 | Ignition Wiring Set and Other Wiring Sets Used in Vehicles, Aircrafts and Ships | -27.1 |
Machinery and Transport Equipment | 62.8 | Other Manufactured Goods | -24.4 |
Electronic Equipment and Parts | 20.3 | Metal Components | -3.0 |
Electronic Products | 15.0 | ||
Miscellaneous Manufactured Articles, n.e.s. | 10.6 | ||
Top 10 Philippine Imports from All Countries: December 2017 p (Year-on-Year Growth in Percent) | |||
|---|---|---|---|
Gainers | Losers | ||
Mineral Fuels, Lubricants and Related Material | 61.8 | Other Food and Live Animals | -0.4 |
Miscellaneous Manufactured Articles | 26.6 | ||
Electronic Products | 20.3 | ||
Telecommunication Equipment and Electrical Machinery | 18.2 | ||
Iron and Steel | 17.9 | ||
Metalliferous Ores and Metal Scrap | 14.3 | ||
Transport Equipment | 3.8 | ||
Plastics in Primary and Non-primary Forms | 3.5 | ||
Industrial Machinery and Equipment | 1.4 | ||
1. TOTAL TRADE SUMS UP TO $13.46 BILLION IN DECEMBER 2017
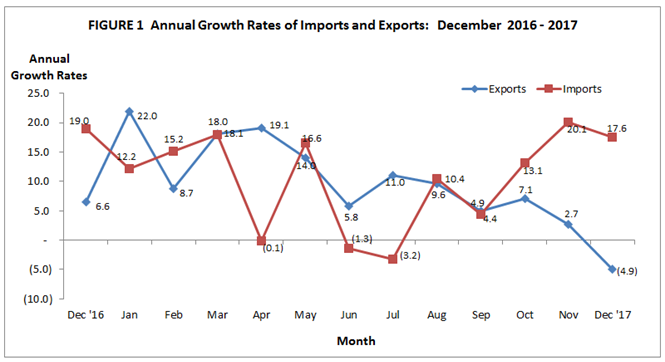
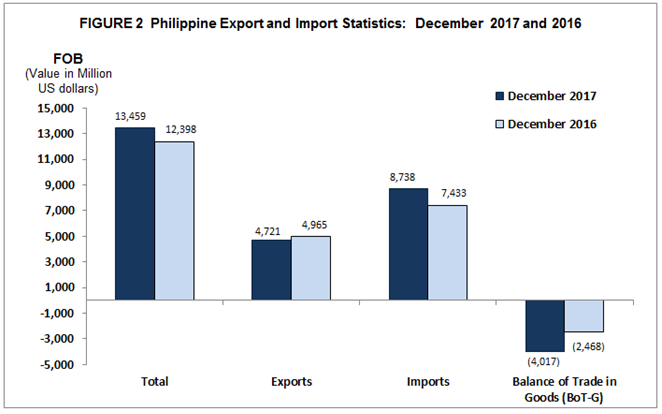
The country’s total external trade in goods in December 2017 reached $13.46 billion, posting a positive growth of 8.6 percent from $12.40 billion registered during the same month in 2016. Total exports dropped by 4.9 percent to $4.72 billion in December 2017 from $4.97 billion in December 2016. On the other hand, total imports increased by 17.6 percent to $8.74 billion in December 2017 from $7.43 billion in December 2016. This resulted to a deficit of $4.02 billion in the country’s balance of trade in goods (BoT-G) in December 2017, higher than the $2.47 billion deficit in December 2016. (Tables 1, 2 and 3)
2. EXPORTS DECLINE BY 4.9 PERCENT WHILE IMPORTS POST A GROWTH OF 17.6 PERCENT
The country’s total export sales reached $4.72 billion in December 2017, recording a decline of 4.9 percent over the value of $4.97 billion in the same month of previous year. This was due to the decreases posted by four out of the top ten commodities for the month. These were: coconut oil (-56.7%); ignition wiring set and other wiring sets used for vehicles, aircrafts and ships (-27.1%); other manufactured goods (-24.4%) and metal components (-3.0%). (Table 2).
On the other hand, total imported goods for the month of December 2017 amounted to $8.74 billion, which increased by 17.6 percent from $7.43 billion posted during the same period of the previous year. The increment was brought about by the positive growth of nine out of the top ten major import commodities for the month. These were the following: mineral fuels, lubricants and related materials (61.8%); miscellaneous manufactured articles (26.6%); electronic products (20.3%); telecommunication equipment and electrical machinery (18.2%); iron and steel (17.9%); metalliferous ores and metal scrap (14.3%); transport equipment (3.8%); plastics in primary and non-primary forms (3.5%) and industrial machinery and equipment (1.4%) (Table 3).
3. EXPORTS OF ELECTRONIC PRODUCTS INCREASE BY 15.0 PERCENT
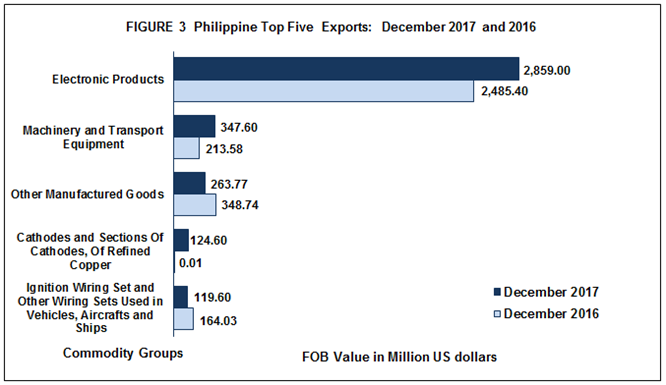
Electronic Products continued to be the country’s top export with total earnings of $2.86 billion, accounting for 60.6 percent share of the total exports revenue in December 2017. It increased by 15.0 percent in December 2017 with $2.49 billion. Components/Devices (Semiconductors), having the biggest share of 45.6 percent among electronic products, posted an increase of 18.9 percent to $2.15 billion in December 2017 from $1.81 billion in December 2016.
Machinery and Transport Equipment was the second top export earner with export revenue of $347.60 million. This export commodity posted an increase of 62.8 percent from the $213.58 million recorded in December 2016.
Other Manufactured Goods ranked third, with $263.77 million or 5.6 percent share of the total export receipts. It dropped by 24.4 percent from December 2016 value of
$348.74 million.
Cathodes & Sections of Cathodes, of Refined Copper was the fourth top export earner with $124.60 million or 2.6 percent share of total exports. It registered the highest growth among the top 10 exports compared to its negligible export value in December 2016.
Ignition Wiring Set and Other Wiring Sets Used in Vehicles, Aircrafts and Ships ranked fifth, posted an export sale of $119.60 million and a share of 2.5 percent in December 2017. Export sales of this commodity group went down by 27.1 percent from $164.03 million recorded in December 2016.
Rounding up the list of the top ten exports and their corresponding sales are:
- Gold, with $115.22 million, went up 198.8 percent;
- Metal Components, with $113.49 million, decreased by 3.0 percent;
- Electronic Equipment and Parts, with $78.57 million, went up by 20.31 percent
- Miscellaneous Manufactured Articles, with $57.90 million, increased by 10.6 percent; and
- Coconut Oil, with $55.89 million, declined by 56.7 percent;
Total receipts from the top ten major exports reached $4.14 billion or 87.6 percent of the total export, posting an increment of 14.4 percent from December 2016 level of $3.61 billion. (Table 2)
Total exports from January to December 2017 was valued at $62.87 billion which grew by 9.5 percent over the $57.41 billion in January to December 2016. (Table 3a)
4. ELECTRONIC PRODUCTS COMPRISE 24.6 PERCENT OF TOTAL IMPORT BILL
Total payment for the country’s top ten imports for December 2017 amounted to $8.74 billion, posting an increase of 17.6 percent over the December 2016 import value of $7.43 billion. (Table 3)
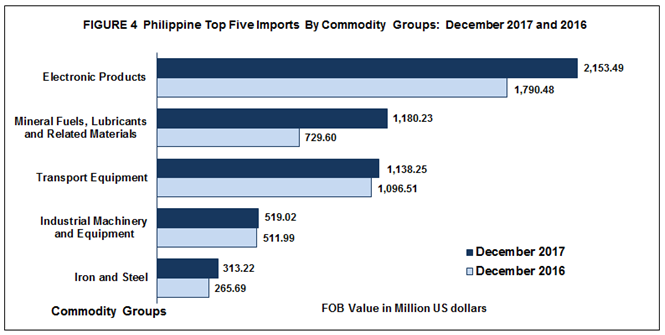
Inbound shipments of Electronic Products in December 2017 accounted for 24.6 percent of the total import bill valued at $2.15 billion. It increased by 20.3 percent from the $1.79 billion posted during the same month of the previous year. Among electronic products, Components/Devices (Semiconductors), reflected the biggest share of 18.1 percent. It went up by 26.4 percent to $1.58 billion in December 2017 from $1.25 billion in December 2016.
Minerals Fuels, Lubricants and Related Materials, comprising 13.5 percent share to total import bills was the country’s second top import for the month amounting to $1.18 billion. It went up by 61.8 percent over the previous year’s value of $729.60 million.
Transport Equipment placed third with an import value of $1.14 billion. This commodity increased by almost 3.8 percent from the previous year’s import value of $1.1 billion.
Imports of Industrial Machinery and Equipment ranked fourth, valued at $519.02 million in December 2017 and a 5.9 percent share to total import. Import of this commodity grew by 1.4 percent from $511.99 million in December 2016.
Iron and Steel, came in fifth with an import value of $313.22 million and a share of 3.6 percent. Import of this commodity increased by 17.9 percent over the last year’s figure of $265.69 million.
Completing the list of the top ten imports for December 2017 were:
- Miscellaneous Manufactured Articles, $297.55 million, rose by 26.6 percent;
- Telecommunication Equipment and Electrical Machinery, $247.19 million, expanded by 18.2 percent;
- Other Food and Live Animals, $243.17 million, dropped by 0.4 percent;
- Metalliferous Ores and metal scrap, $231.96 million, expanded by 14.3 percent; and
- Plastics in primary and Non-primary forms, $173.57 million, grew by 3.5 percent.
Total payment for the country’s top ten imports for December 2017 amounted to $6.50 billion, posting an increase of 19.2 percent over the previous year’s import value of $5.45 billion. (Table 3)
Total imports from January to December 2017 was valued at $92.66 billion which grew by 10.2 percent over the $84.11 billion in January to December 2016. (Table 3a)
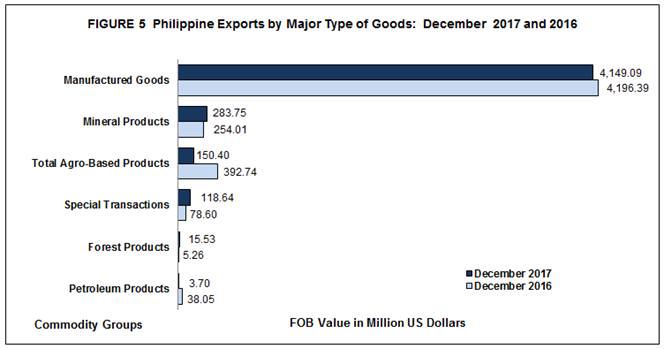
5. EXPORTS OF MANUFACTURED GOODS DECREASE BY 1.1 PERCENT
Exports of Manufactured Goods, with a share of 87.9 percent of total exports, were valued at $4.15 billion, in December 2017 (Table 4). It decreased by 1.1 percent compared to $4.20 billion export value in December 2016.
Total Agro-Based Products with an export value of $150.40 million and a share of 3.2 percent, declined by 61.71 percent in December 2017.
Exports from Mineral Products accounting for a 6.01 percent share amounted to $283.75 million, with an increase of 11.7 percent in December 2017
Merchandise exports from Special Transactions, with a share of 2.5 percent to the total export revenue, increased by 50.9 percent in December 2017 from the previous year’s figure of $78.60 million.
Petroleum Products with 0.1 percent share amounting to $3.70 million, declined by 65.1 percent from $38.05 million in December 2016.
Exports of Forest Products accounting for 0.3 percent share of the total exports had a value of $15.53 million. Exports of this goods surged by 195.2 percent in December 2017.
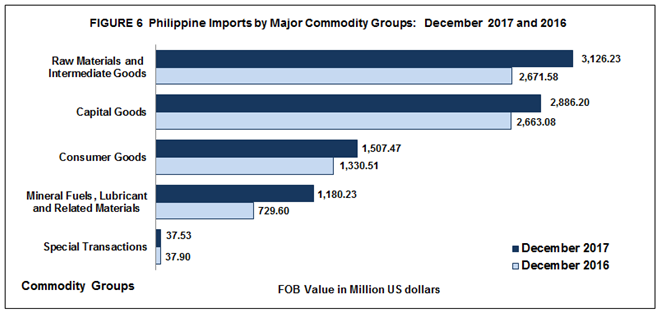
6. IMPORTS OF RAW MATERIALS AND INTERMEDIATE GOODS COMPRISE 35.8 PERCENT
By major type of goods, imports of Raw Materials and Intermediate Goods accounted for the largest share of 35.8 percent to total imports. It went up by 17.0 percent to $3.13 billion in December 2017 from $2.67 billion in December 2016. Semi-Processed Raw Materials, valued at $2.73 billion, accounted for 31.2 percent share of the commodity group. Import of this commodity increased by 18.6 percent from the $2.30 billion posted in December 2016. (Table 5)
Imports of Capital Goods in December 2017 amounted to $2.89 billion, accounting for a 33.0 percent share of the total imports. It went up by 8.4 percent over the previous year's import value of $2.66 billion.
Imports of Consumer Goods comprising an 17.3 percent share amounted to $1.51 billion in December 2017. It increased by 13.3 percent from $1.33 billion registered in December 2016.
Mineral Fuels, Lubricants and Related Materials accounting for 13.5 percent share of total imports, advanced by 61.8 percent to $1.18 billion in December 2017 from $729.60 million in December 2016. Other mineral fuels, lubricants and related materials such as gas oils and greases had the biggest share of imports for this commodity group at 8.1 percent valued at $707.79 million.
Moreover, imports of Special Transactions, declined by almost 1.0 percent from $37.90 million registered in December 2016 to $37.54 million in December 2017.
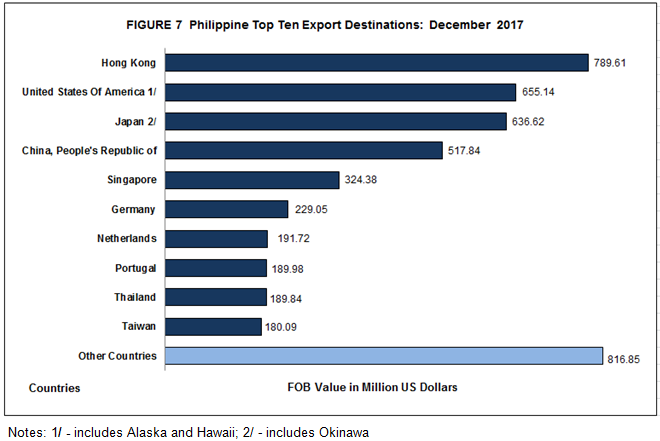
7. EXPORTS TO HONG KONG INCREASE BY 16.7 PERCENT
Total exports receipt recorded by the country’s top ten market destinations for the December 2017 amounted to $3.90 billion or 82.7 percent share of the total (Table 6).
Hong Kong, ranked first with an export value of $789.61 million and a share of 16.7 percent of total exports in December 2017. It increased by 27.3 percent from $620.33 million in December 2016.
United States of America (USA), including Alaska and Hawaii, placed second with exports valued at $655.14 million, contributing 13.9 percent share of the total exports for December 2017. It decreased by 7.6 percent from $709.08 million recorded in December 2016.
Japan, including Okinawa came in third with $636.62 million or 13.5 percent share of the total exports. It went down by 34.4 percent from $970.40 million in the same month of the previous year.
People’s Republic of China, ranked fourth with export shipments valued at $517.84 million and a share of 11.0 percent. Exports to this country went down by 14.7 percent from $607.07 million recorded in the same month of the previous year.
Singapore placed fifth, accounting for 6.9 percent share of total exports, recording a value of $324.38 million. It grew by 13.4 percent from $285.94 million posted in December 2016.
Completing the top ten market destinations for December 2017 were: Germany, $229.05 million; Netherlands, $191.72 million; Portugal, $189.98 million Thailand, $189.84 million; and Taiwan, $180.09 million.
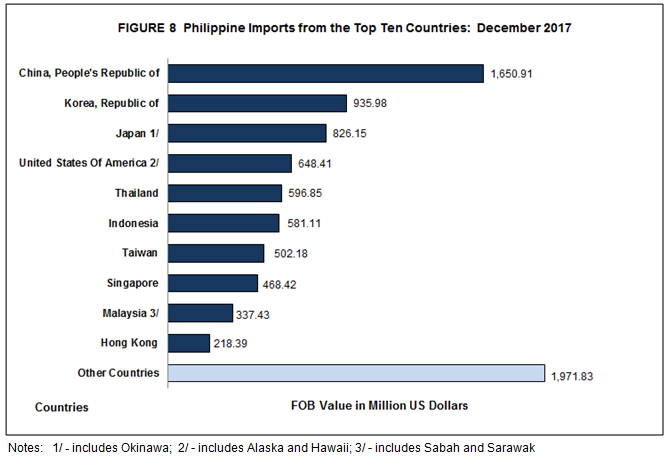
8. IMPORTS FROM PEOPLE’S REPUBLIC OF CHINA COMPRISE 18.9 PERCENT
Import bills from the top ten countries for imports for December 2017 amounted to $6.77 billion or 77.4 percent of the total.
People’s Republic of China was the country’s biggest source of imports with 18.9 percent share in December 2017. Import payments to this country stood at $1.65 billion, posting an increase of 28.3 percent from $1.29 billion in December 2016.
Republic of Korea came in second, with imports valued at $935.98 million in December 2017 contributing a share of 10.7 percent. Import from this country rose to 45.0 percent from $575.20 million in December 2016.
Japan, including Okinawa placed third, accounting for 9.5 percent with an import value of $826.15 million in December 2017. It went up by 6.8 percent from the December 2016 value of $946.02 million.
United States of America (USA), including Alaska and Hawaii comprising for 7.4 percent share, placed fourth with imports valued at $648.41 million in December 2017. Import bills to this country declined by 14.0 percent from $754.26 million in December 2016.
Thailand, ranked fifth, with a 6.8 percent share of the total import bills in December 2017. It grew by 9.5 percent to $596.85 million in December 2017 from $544.91 million in December 2016.
Rounding the list of major sources of imports for the month of December 2017 were: Indonesia, $581.11million; Taiwan, $502.18 million; Singapore, $468.42 million; Malaysia (includes Sabah and Sarawak), $337.43 million; and Hong Kong, $218.39 million.
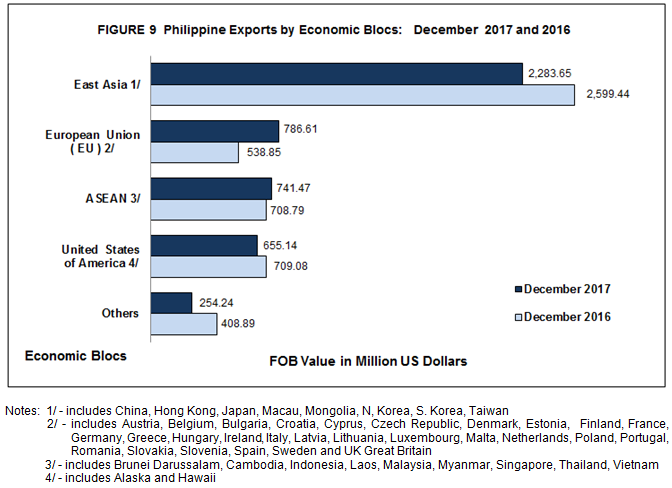
9. EXPORTS TO COUNTRIES IN EAST ASIA ACCOUNT FOR 48.4 PERCENT
By economic bloc, the bulk of the country’s merchandise exports in December 2017 went to countries in East Asia, comprising for 48.4 percent share of total exports valued at $2.28 billion. It fell by 12.2 percent from $2.60 billion in December 2016.
Commodities exported to European Union member countries comprised 16.7 percent of the total exports in December 2017 valued at $786.61 million. This registered an increment of 45.9 percent from $538.85 million posted in the same month of the previous year. (Table 7)
Exports to ASEAN member countries, was valued at $741.47 million and a share of 15.7 percent of total merchandise exports. It went up by 4.6 percent from $708.79 million registered in December 2016.
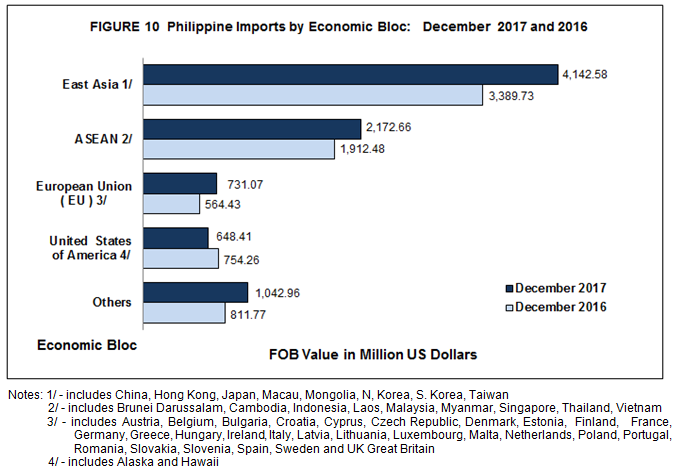
10. IMPORTS FROM COUNTRIES IN EAST ASIA ACCOUNT FOR 47.4 PERCENT
By economic bloc, East Asia (China, Hong Kong, Japan, Macau, Mongolia, North Korea, South Korea and Taiwan) was the biggest supplier of the country’s imports in December 2017 representing 47.4 percent of the total imports valued at $4.14 billion. It posted a growth of 22.0 percent from $3.39 billion in December 2016.
Commodities imported from ASEAN member countries amounted to $2.17 billion. It comprised a 24.9 percent share to the total imports increasing by 13.6 percent from the previous year’s import valued at $1.91 billion.
Imports from European Union reached $731.07 million. It grew by 29.5 percent from the previous year’s value of $564.33 million. (Table 9)
Technical Notes
Export and Import trade statistics are compiled by the Philippine Statistics Authority (PSA) from copies of export and import documents submitted to the Bureau of Customs (BOC) by exporters and importers or their authorized representatives as required by law. PSA collects copies of these accomplished forms. These are the following documents:
Export Declaration (ED – DTI form)
Import Entry & Internal Revenue Declaration (BOC IEIRD Form 236)
Informal Import Declaration and Entry (BOC Form 177)
Single Administrative Documents (SAD)
The output of the Automated Export Documentation System (AEDS) of the BOC is being utilized to generate export statistics. AEDS is a paperless transaction in lieu of the manual filling-up of export documents.
Moreover, an electronic copy of the IEIRD, or SAD, is utilized to capture the monthly import figures. SAD-IEIRD is an on-line submission of import documents either by brokers or companies. These are transactions that pass through the Automated Cargo Operating System (ACOS), now called the e2m (electronic to mobile) customs system, a system implemented through the BOC e-Customs Project.
All documents (hard copies and e-files) received before the cut-off date which is every 25th day of the month, are compiled, processed and generated in monthly statistical tables for the preparation of Press Release. All documents received after the cut-off date, however, are processed and included in the generation of the revised monthly statistical tables.
The digitized copies of all documents are provided by BOC and PEZA to PSA on a monthly basis through email.
Processing includes coding, editing, review and validation. Revised statistical tables are made available 10 to 15 working days after the press release date.
The Press Release for a reference month is due 40 days after every month. However, if the 10th day falls on a Saturday, release will be on Friday but if it falls on a Sunday or Monday the release will be on Tuesday. If the release date falls on a holiday, the date of release is moved accordingly.
The 2004 Philippine Standard Commodity Classification (PSCC) is used to classify the commodities at the most detailed 10-digit code level for statistical purposes.
Data requests of international merchandise trade statistics are available at Philippine Statistics Authority, Economic Sector Statistics Service, Trade Statistics Division (Telephone Number: 376-19-75).
| Attachment | Size |
|---|---|
|
|
488.02 KB |
|
|
222 KB |