
QUANTITY AND VALUE OF DOMESTIC TRADE INCREASE IN 2016
The total quantity of domestic trade in 2016 was recorded at 24.35 million tons, up by 25.0 percent from 19.49 million tons posted in 2015. Food and live animals commodities were the highest in quantity with 6.61 million tons of all the traded commodities while animal and vegetable oils, fats and waxes had the least with less than 0.10 million tons.

On the other hand, total value of domestic trade in 2016 rose by 35.6 percent, from PHP642.64 billion in 2015 to PHP871.67 billion in 2016. Machinery and transport equipment posted the highest value of PHP281.71 billion in 2016. On the other hand, the lowest value of PHP2.95 billion was registered for animal and vegetable oils, fats and waxes.
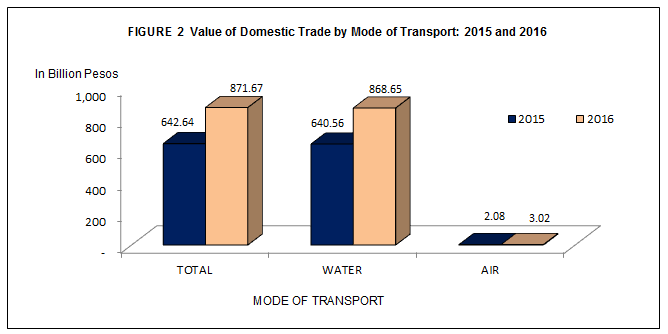
By mode of transport, total value of traded commodities in 2016 through water transport accounted for 99.6% of the total commodities that flow in the country while the remaining 0.4% was through air transport.
MACHINERY AND TRANSPORT EQUIPMENT ACCOUNTS FOR THE HIGHEST SHARE IN VALUE
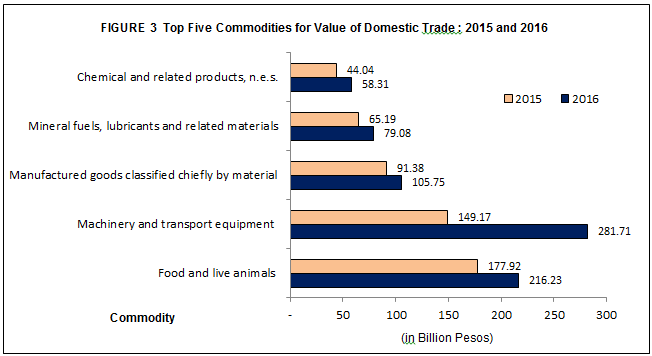
Machinery and transport equipment contributed the largest value amounting to PHP281.71 billion among the traded commodities throughout the country in 2016. Food and live animals with PHP216.23 billion or 24.8 percent share to total value and manufactured goods classified chiefly by material with
- Mineral fuels, lubricants and related materials, PHP79.08 billion;
- Chemical and related products nec, PHP58.31 billion;
- Beverages and tobacco, PHP45.47 billion;
- Miscellaneous manufactured articles, PHP40.80 billion;
- Commodities and transactions nec, PHP24.80 billion;
- Crude materials, inedible, except fuels, PHP16.886 billion; and
- Animal and vegetable oils, fats and waxes, PHP2.95 billion
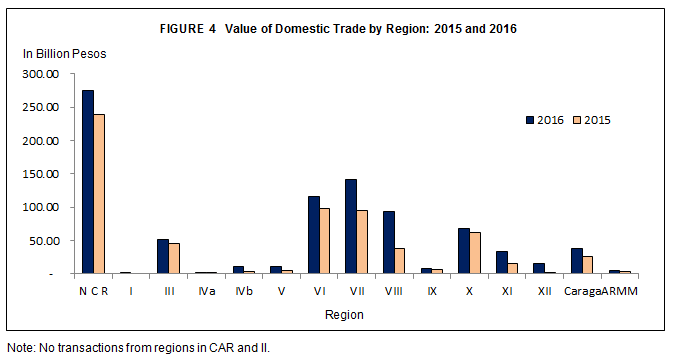
NATIONAL CAPITAL REGION (NCR) ACCOUNTS FOR THE LARGEST SHARE IN TRADE VALUE
Among the regions, NCR exhibited the largest share in value amounting to PHP275.64 billion or 31.6 percent of the total trade. Central Visayas followed with transactions amounting to PHP141.65 billion. Placed third and fourth were: Western Visayas with value amounting to PHP116.32 billion and Eastern Visayas, PHP93.98 billion. On the other hand, Ilocos Region’s contributed the least share with only PHP1.52 million. Completing the list of regions with corresponding values in 2016 were the following:
- Northern Mindanao, PHP68.79 billion;
- Central Luzon, PHP51.33 billion;
- Caraga, PHP38.11 billion;
- Davao Region, PHP34.21 billion;
- SOCCSKSARGEN, PHP15.00 billion;
- MIMAROPA, PHP11.32 billion;
- Bicol Region, PHP11.01 billion;
- Zamboanga Peninsula, PHP8.70 billion; and
- ARMM, PHP4.79 billion
VALUE OF TOTAL TRADE FOR COMMODITIES RISE IN 2016
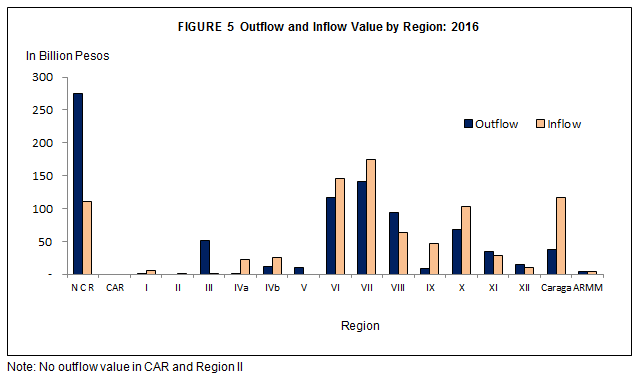
Outflow refers to the total quantity and value of commodities which goes out of the specified region or province while Inflow refers to the total quantity and value of commodities coming in the specified region. Trade balance is the difference between the outflow and inflow.
Total outflow value in the 2016 was registered at PHP871.67 billion, up by 35.6 percent from the 2015 value of PHP642.64 billion. NCR posted the highest outflow value amounting to PHP275.640 billion or 31.6 percent from the total outflow in the country. It was followed by Central Visayas and Western Visayas with PHP141.65 billion and PHP116.316 billion, respectively. Ilocos Region had the least outflow value with PHP1.52 million only in 2016.
In terms of inflow value, Central Visayas recorded the biggest inflow value amounting to PHP173.96 billion in 2016. This translates to 19.9 percent share to total of all traded commodities. Cordillera Administrative Region had the smallest inflow value of PHP10,000 in 2016.
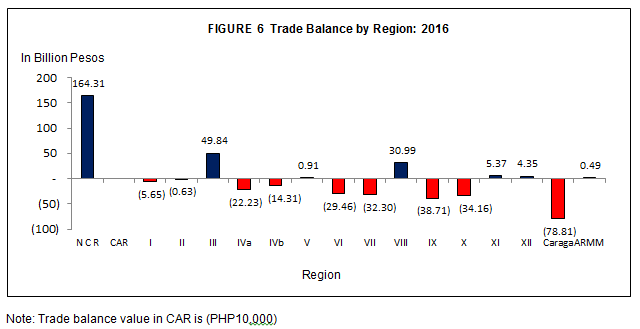
NCR POSTS HIGHEST POSITIVE TRADE BALANCE
Out of the 17 regions, 10 regions showed unfavorable trade balance while seven (7) regions yielded positive trade balance. These were the following:
- NCR, PHP164.31billion (the highest trade balance value);
- Central Luzon, PHP49.84 billion;
- Eastern Visayas, PHP30.99 billion;
- Davao Region, PHP5.37 billion;
- SOCCSKSARGEN, PHP4.34 billion;
- ARMM, PHP4.29 billion; and
- Bicol Region, PHP912.20 million
THE VISAYAS LEADS DOMESTIC TRADE VALUE IN 2016
The Visayas group (Western Visayas, Central Visayas and Eastern Visayas) topped in terms of domestic trade value in 2016 with value amounting to

Most traded commodities in Luzon were Food and live animals with PHP80.792 billion or 23.0 percent share to total, posting the highest. It was followed by Machinery and transport equipment with PHP69.28 billion or 19.8 percent. Mineral fuels, lubricants and related materials placed third with PHP51.71 billion or 14.8 percent.
The top three commodity sections in terms of its contribution to the total value of traded commodities in Visayas were the following: machinery and transport equipment (PHP156.72 billion or 44.5 percent), food and live animals (PHP78.23 billion or 22.2 percent) and manufactured goods classified chiefly by material (PHP35.50 billion or 10.0 percent).
In Mindanao, Food and live animals recorded the highest domestic traded commodities with value at PHP57.211 billion.
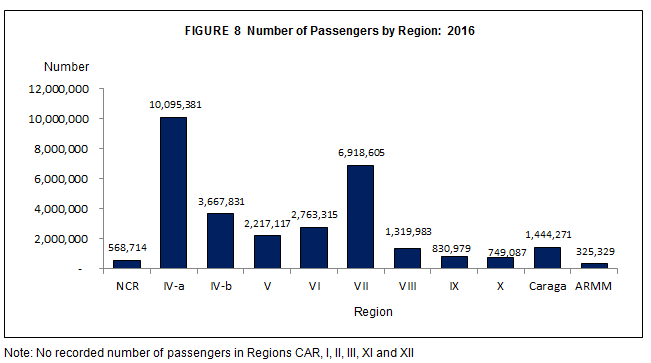
NUMBER OF PASSENGERS UP IN 2016
A total of 30.90 million passengers were transported via coastwise in 2016, an increase of 50.9 percent, from the 20.48 million passengers in 2015. CALABARZON led the highest number of passenger with 10.10 million of the total passengers in 2016. Central Visayas and MIMAROPA placed second and third with 6.92 million passengers and 3.67 million passengers, respectively. Other regions with total number of passengers were the following:
- Western Visayas, 2.76 million;
- Bicol Region, 2.2 million;
- Caraga, 1.44 million;
- Eastern Visayas, 1.32 million;
- Zamboanga Peninsula, 0.83 million;
- Northern Mindanao, 0.75 million;
- NCR, 0.57 million; and
- ARMM, 0.33 million
TECHNICAL NOTES
Introduction
This Special Release highlights the 2016 Annual Domestic Trade Statistics data on the movement of commodities from coastwise manifest and coastwise passenger manifest.
Copies of coastwise manifests are collected from the Philippine Port Authority while copies of air waybills from the Philippine Airlines. Coastwise manifests contain data on cargoes on board. These are from major ports and other active seaports listed by the PPA all over the country.
Data on the inflow and outflow of commodities in the different regions of the country are used to construct inter-regional and inter-industry relation tables.
The 1993 Philippine Standard Commodity Classification (PSCC) is used to classify the commodities at the 5-digit (item) for coastwise statistics, and 3-digit (group) for air statistics for statistical purposes.
Detailed data on domestic trade statistics are available at the Trade Statistics Division (TSD) - Economic Sector Statistics Service (ESSS) with telephone number: 376-19-75.
Limitations of Domestic Trade Data
The Domestic trade data in this report pertains to goods that passed through airports and seaports in the country, whether for government or private use, or for commercial purposes. Domestic trade through land is excluded because of an absence of an approach to capture data in the archipelagic island of the country. Moreover, data on rail transport is also excluded.
Air waybills, on the other hand, were collected only from the Philippine Airlines (PAL) accounting for transactions that passes through all airports.
Goods and/or commodities that were excluded in the compilation of data are:
- Goods transported by vessels of the Philippine Navy.
- Fish and other marine products landed directly from the sea.
- Service cargoes for consumption by vessel crew.
- Cadaver
- Vessels not carrying any cargo / passenger, wherein the vessel master indicates "NIL CARGO / PASSENGER" in the coasting / passenger manifests.