
GENERAL WHOLESALE PRICE INDEX (GWPI)
(1998=100)
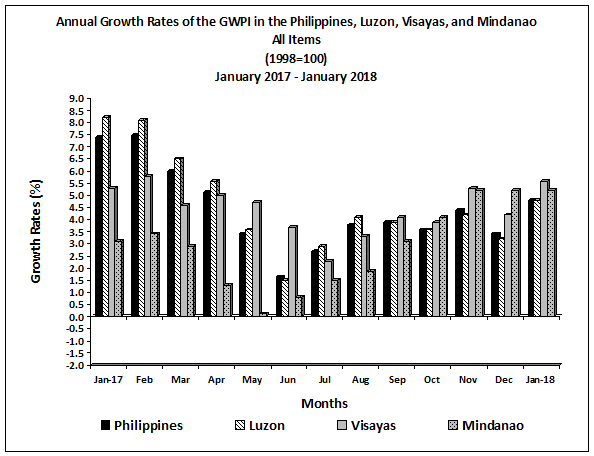
Year-on-Year Growth Rates, All Items
January 2017 - January 2018
Year/Month | Philippines | Luzon | Visayas | Mindanao |
|---|---|---|---|---|
| 2018 | ||||
| January | 4.8 | 4.8 | 5.6 | 5.2 |
| 2017 | 4.4 | 4.6 | 4.3 | 2.7r |
| December | 3.4 | 3.2 | 4.2 | 5.2r |
| November | 4.4 | 4.2 | 5.3 | 5.2 |
| October | 3.6 | 3.6 | 3.9 | 4.1 |
| September | 3.9 | 3.9 | 4.1 | 3.1 |
| August | 3.8 | 4.1 | 3.3 | 1.9 |
| July | 2.7 | 2.9 | 2.3 | 1.5 |
| June | 1.6 | 1.5 | 3.7 | 0.8 |
| May | 3.4 | 3.6 | 4.7 | 0.1 |
| April | 5.1 | 5.6 | 5.0 | 1.3 |
| March | 6.0 | 6.5 | 4.6 | 2.9 |
| February | 7.5 | 8.1 | 5.8 | 3.4 |
| January | 7.4 | 8.2 | 5.3 | 3.1 |
r - revised
• Year-on-Year
The annual rate of General Wholesale Price Index (GWPI) at the national level went up by 4.8 percent in January 2018. In the previous month, its annual adjustment settled to 3.4 percent and in January 2017, 7.4 percent. Faster annual increments were noted in the indices of the following commodity groups:
Beverages and Tobacco (14.2%);
Mineral Fuels, Lubricants and Related Materials (20.1%);
Manufactured Goods Classified Chiefly by Materials (1.7%); and
Miscellaneous Manufactured Articles (0.7%).
In addition, the annual movement of chemicals including animal and vegetable oils and fats index went up by 0.5 percent from -2.9 percent in the previous month. A lower annual increase of 1.1 percent was, however, registered in the index of machinery and transport equipment. The annual change in crude materials, inedible except fuels index decreased by 7.7 percent while that of the food index retained its previous month’s rate of 1.0 percent (see Table 1.1).
> On an annual basis, the GWPI in Luzon climbed by 4.8 percent in January 2018. Its annual change was pegged at 3.2 percent in December 2017 and 8.2 percent in January 2017. Double-digit annual rates were recorded in the indices of beverages and tobacco at 12.7 percent and mineral fuels, lubricants and related materials, 21.2 percent. Moreover, annual mark-ups in the indices of manufactured goods classified chiefly by materials were higher at 1.8 percent and miscellaneous manufactured articles, 0.7 percent. On the other hand, a slower annual increase of 0.6 percent was recorded in the index of machinery and transport equipment. Meanwhile, the annual change of the heavily-weighted food index fell by 0.2 percent; crude materials, inedible except fuels index, -7.8 percent; and chemicals including animal and vegetable oils and fats index, -0.3 percent (see Table 2.1).
> In Visayas, the annual adjustment of GWPI rose by 5.6 percent in January 2018. It was pegged at 4.2 percent in December 2017 and 5.3 percent in January 2017. Higher annual upticks were posted in the indices of the following commodity groups:
Food (5.3%);
Beverages and Tobacco (16.0%);
Mineral Fuels, Lubricants and Related Materials (14.8%); and
Machinery and Transport Equipment (3.8%).
However, slowdowns in the annual hikes were correspondingly observed in the indices of chemicals including animal and vegetable oils and fats at 5.3 percent and miscellaneous manufactured articles, 0.5 percent. Meanwhile, the index of crude materials, inedible except fuels exhibited an annual decrease of 10.8 percent (see Table 3.1).
> In Mindanao, the annual movement of GWPI in January 2018 rose by 5.2 percent. This was the same rate in December 2017 while in January 2017, its annual growth was registered at 3.1 percent. Except for food and beverages and tobacco indices whose annual mark-ups correspondingly slowed down to 5.5 percent and 27.0 percent, all the commodity groups registered higher annual increments during the month (see Table 4.1).
• By Commodity Group, Month-on-Month
On a monthly basis, the GWPI at the national level increased by 1.9 percent in January 2018. In December 2017, its rate was registered at 0.1 percent. Higher increases were noted in the indices of the following commodity groups:
Beverages and Tobacco (3.8%);
Mineral Fuels, Lubricants and Related Materials (8.2%);
Manufactured Goods Classified Chiefly by Materials (1.1%); and
Miscellaneous Manufactured Articles (0.4%).
Uptick in the index of chemicals including animal and vegetable oils and fats eased to 0.1 percent. Moreover, the food index dropped by 0.3 percent and crude materials inedible except fuels index, -0.7 percent (see Table 1.2).
Price hikes in petroleum products pushed up the indices of mineral fuels, lubricants and related materials in Luzon by 8.6 percent; Visayas, 6.6 percent; and Mindanao, 3.3 percent. For the Philippines, the group’s index moved upward by 8.2 percent.
The index of manufactured goods classified chiefly by materials in Luzon picked up by 1.3 percent due to the upward adjustments in the prices of selected construction materials during the month. Meanwhile, higher prices in selected construction materials, plywood, newsprint, paper products, abaca rope, glass and glass products in Mindanao resulted to a 0.7 percent increase in its group’s index. The group’s index in Visayas, however, had zero growth during the month. At the country level, the group index rose by 1.1 percent.
The beverages and tobacco index in Luzon advanced by 3.9 percent; Visayas, 2.3 percent; and Mindanao, 4.2 percent. This was effected by the acceleration in the prices of liquors, softdrinks and cigarettes during the month. At the country level, the group’s index climbed by 3.8 percent.
A 0.4 percent growth recorded in miscellaneous manufactured articles index in Luzon was due to higher prices of selected ready-made clothing items. The group’s index in Mindanao likewise, went up by 0.4 percent brought about by the upward adjustments in the prices of selected sanitary fixtures, steel bed, foam mattress, selected clothing items, office and school supplies. On the other hand, the group’s index in Visayas dropped by 0.1 percent as prices of selected sanitary fixtures were lower during the month. At the national level, the group’s index went up by 0.4 percent.
The index of chemicals including animal and vegetable oils and fats in Luzon increased by 0.1 percent. Prices of medical and pharmaceutical preparations were higher in the area. Meanwhile, caustic soda, selected fertilizers, plastic sheet, some medical and pharmaceutical preparations and toilet soap were priced higher in Mindanao. Thus, the group’s index in the area rose by 0.6 percent. In Visayas, the group’s index dropped by 0.2 percent due to lower prices of fertilizers. For the Philippines, the group’s index inched up by 0.1 percent.
Lower price of copra primarily pushed down the index of crude materials, inedible except fuels in Luzon by 0.9 percent. On the contrary, the group’s index in Mindanao increased by 0.9 percent. This can be attributed to higher prices of charcoal, sand and gravel. The group’s index in Visayas, however, had zero growth during the period. At the country level, the group’s index decreased by 0.7 percent.
The food index in Luzon declined by 0.7 percent as prices of liveweight chicken, fruits, vegetables, sugar and desiccated coconut were lower during the period. In Visayas, prices of beef, selected canned meat products, milk, butter, fish, fruits, vegetables, cocoa and chocolate products went up during the month. Thus, the food index in the area picked up by 1.7 percent. Similarly, upward adjustments in the prices of meat, dairy products, unmilled corn, rice, sugar and starch raised the group’s index in Mindanao by 0.3 percent. The food index at the country level dropped by 0.3 percent.
The machinery and transport equipment index in Visayas inched up by 0.2 percent as battery was priced higher during the period. The group’s index in Mindanao, likewise, picked up by 0.4 percent. This was brought about by higher prices of radio set, insulated electrical wire and air conditioning machine in the area. On the other hand, decreases in the prices of selected electrical wires in Luzon resulted to a 0.1 percent decline in its group’s index. For the Philippines, the group’s index had zero growth.
| Attachment | Size |
|---|---|
|
|
125 KB |
|
|
131.15 KB |
|
|
99.07 KB |
|
|
148.4 KB |
|
|
120.21 KB |
|
|
112.3 KB |