
| TABLE A Comparative Construction Statistics | ||
|---|---|---|
| 2017 and 2016 | ||
| (Details may not add up to total due to rounding) | ||
| Type of Construction | 2017 | 2016 |
| TOTAL | ||
| Number | 152,012 | 147,998 |
| Floor Area (sq.m.) | 31,884,027 | 32,526,542 |
| Value (PHP '000) | 333,214,520 | 378,895,886 |
| RESIDENTIAL | ||
| Number | 110,942 | 113,097 |
| Floor Area (sq.m.) | 16,301,228 | 17,592,013 |
| Value (PHP '000) | 164,153,250 | 187,599,731 |
| NON-RESIDENTIAL | ||
| Number | 21,349 | 17,845 |
| Floor Area (sq.m.) | 15,035,707 | 14,421,105 |
| Value (PHP '000) | 143,315,470 | 162,517,347 |
| Additions | ||
| Number | 5,086 | 4,504 |
| Floor Area | 547,092 | 513,424 |
| Value | 4,301,000 | 4,759,614 |
| Alterations and Repairs | ||
| Number | 14,635 | 12,552 |
| Value | 21,444,800 | 24,019,195 |
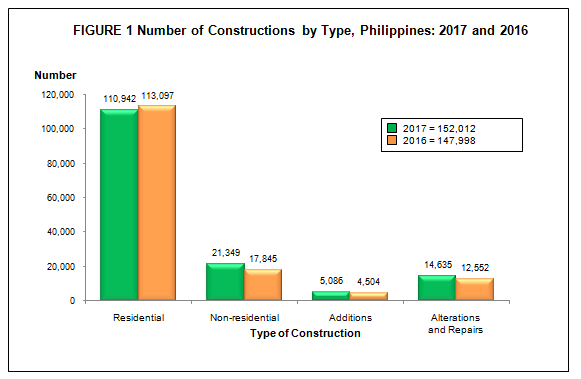
Number of constructions posts a 2.7 percent growth in 2017
The total number of constructions generated from approved building permits for the year 2017 reached 152,012. This number represents an increase of 2.7 percent from the 147,998 constructions recorded in 2016
Residential building constructions numbering to 110,942 declined by 1.9 percent from 113,097 constructions reported during the same period in 2016. This was due to the decline in duplex/quadruplex-type (12.2%) residential condominium (34.9%) and single-type houses (2.1%) construction.
Meanwhile, non-residential constructions numbering to 21,349 posted a 19.6 percent increase from its previous year’s count of 17,845. The growth was brought about by the double-digit increase in the number of constructions of the following: agricultural buildings (23.2%), commercial buildings (22.9%), industrial buildings (20.6%), and other non-residential buildings with (33.5%).
Additions to existing structures increased to 5,086 projects from 4,504 during the same period of 2016 or an increase of 12.9 percent. Likewise, combined number of alterations and repairs of existing structures increased by 16.6 percent from 12,552 projects recorded in the previous year.
Figure 1 compares the number of constructions by type for 2017 and 2016.
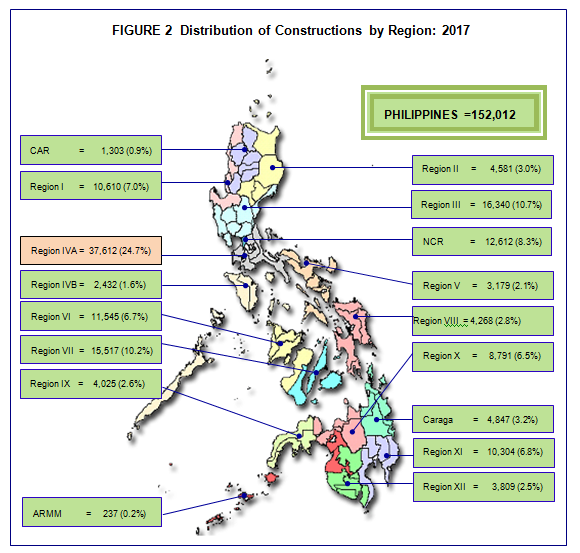
The top five regions, in terms of number of constructions, collectively comprised 61.6 percent of the total constructions. CALABARZON led these regions with a total of 37,612 (24.7%) constructions. Central Luzon ranked second with 16,340 (10.7%) constructions. Other regions completing the top five were:
Central Visayas with 15,517 (10.2%) constructions
National Capital Region (NCR) with 12,612(8.3%) constructions
Western Visayas with 11,545 (7.6%) constructions
Figure 2 shows the distribution of constructions by region.
At the provincial level, the top ten provinces in terms of the number of construction projects accounted for 44.5 percent of the total projects. Cavite topped the list of provinces with 16,904 (11.1%) constructions, followed by Batangas and Cebu with respective shares of 7,017 (4.6%) and 6,982 (4.6%) constructions. Completing the top ten provinces with the most number of constructions were:
Bulacan with 6,206 (4.1%) constructions
Laguna with 5,804 (3.8%) constructions
Fourth District of NCR with 5,240 (3.4%) constructions
Davao del Sur with 5,043 (3.3%) constructions
Rizal with 4,966 (3.3%) constructions
Negros Occidental with 4,921 (3.2%) constructions
Iloilo with 4,518 (3.0%) constructions
Among the top ten provinces, Batangas posted the largest increase in the number of construction of 25.0 percent, from 5,612 in 2016 to 7,017 in 2017.
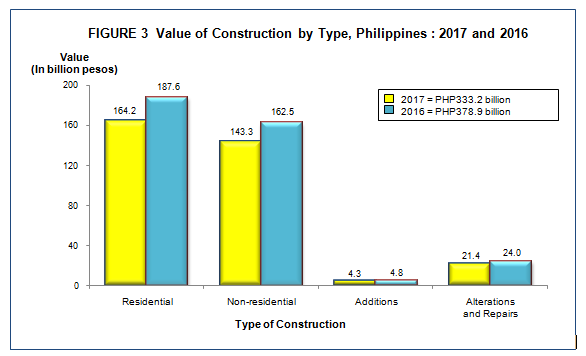
Total value of constructions declined by12.1 percent
Total value of constructions, estimated at PHP333.2 billion, dropped by 12.1 percent compared with the registered amount of PHP378.9 billion in 2016.
Residential constructions, valued at PHP164.2 billion, declined by 12.5 percent from the PHP187.6 billion recorded in 2016. This was due to the decline in construction values for residential type of constructions led by residential condominiums (41.8%), followed by duplex/quadruplex (6.1%).
Construction value of non-residential buildings, amounting to PHP143.3 billion, declined by 11.8 percent compared with the PHP162.5 billion construction value recorded the previous year. This was due to the decline in the construction values of industrial (26.6%) and commercial (20.4%) buildings.
Similarly, construction values for addition to existing structures at PHP4.3 billion decreased by 9.6 percent from PHP4.8 billion posted in 2016. Combined construction values of alteration and repair of existing structures, estimated at PHP21.4 billion, declined by 10.7 percent from the registered value of PHP24.0 billion in 2016.
Figure 3 compares the value of constructions by type for the years 2017 and 2016.
In terms of value of construction, the combined shares of the top five regions, amounting to PHP249.1 billion, comprised 74.8 percent of the total value of construction. NCR, ranking fourth in the number of construction projects, occupied the top slot with estimated value of PHP101.1 billion or 30.4 percent of the total value of construction. Other regions in the top five list for 2017 were:
CALABARZON, PHP61.6 billion (18.5%)
Central Luzon, PHP33.4 billion (10.0%)
Central Visayas, PHP31.7 billion (9.5%)
Western Visayas, PHP21.2 billion (6.4%)
Average cost of residential-type building is PHP10,070 per square meter in 2017
In 2017, total value of residential building constructions was estimated at PHP164.2 billion with a total floor area of 16.3 million square meters, which translated to PHP10,070 average cost per square meter. This figure is 5.6 percent lower than the average cost per square meter of PHP10,664 in 2016.
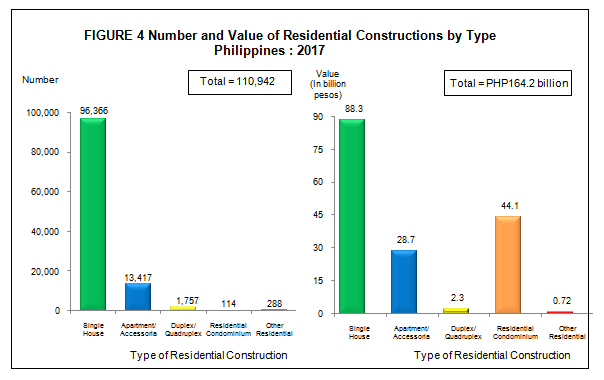
Among residential constructions, single-type houses recorded the most number with 95,366 or 86.0 percent of the total. Total value of construction for this typewas estimated at PHP88.3 billion with a total floor area of 9.6 million square meters, or an average cost of PHP9,162 per square meter.
Apartment/accessoria-type units ranked a far second with 13,417 projects representing 12.1 percent of total residential constructions. This type of construction had an estimated value of PHP28.7 billion with a total floor area of 3.4 million square meters or an average cost of PHP8,328 per square meter.
Duplex/quadruplex-type dwellings, which came next to apartment/accessoria-type, had 1,757 projects or 1.6 percent of the total residential constructions. For this type of residential construction, total value amounted to PHP2.3 billion and total floor area was 260.2 thousand square meters or an average cost per square meter of PHP8,971.
Residential condominiums, which recorded the least count of 114, had construction value of PHP44.1 billion and a total floor area of 2.9 million square meters. Average cost per square meter for this type was PHP15,241.
Figure 4 displays the number and value of residential constructions by type in 2017.
Average cost per square meter of non-residential constructions is PHP9,532
Total value of non-residential construction in 2017 reached PHP143.3 billion covering a total floor area of 15.0 million square meters. This translates to an average cost of PHP9,532 per square meter with a decrement of 15.4 percent compared with PHP11,269 average cost per square meter posted a year ago.
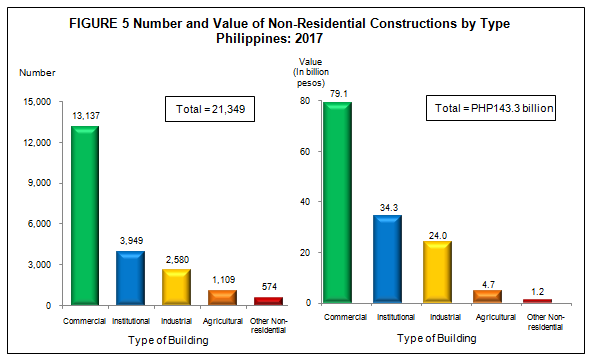
Commercial-type buildings numbering to 13,137 or 61.5 percent dominated all other types of non-residential constructions. Value of construction for this type amounted to PHP79.1 billion with a total floor area of 7.5 million square meters or an average cost of PHP10,544 per square meter.
Institutional-type buildings followed next with 3,949 or 18.5 percent share of the total non-residential construction. Construction value for this type was PHP34.3 billion and with total floor area of 2.9 million square meters, translating to an average cost of PHP11,996 per square meter.
Industrial-type buildings came third with 2,580 construction(12.1%).Total construction value for this type was estimated at PHP24.0billion with a total floor area of 3.7million square meters or an average cost per square meter of PHP6,529.
Agricultural-type buildings recorded a total of 1,109 constructions or 5.2 percent of the total non-residential constructions. Construction value for this type amounted to PHP4.7 billion with a total floor area of 990.3 thousand square meters or an average cost per square meter of PHP4,716.
Figure 5 shows the number and value of non-residential constructions by type 2017.
Approved by:
TECHNICAL NOTES
CONSTRUCTION STATISTICS FROM APPROVED BUILDING PERMITS
Introduction
This Special Release presents the final data on construction statistics from approved building permits for the year 2017.
The final data set provides updates to the 2017 Quarterly Special Releases on construction statistics. The sources of updates are additional approved building permits collected after cut-off dates because of data collection constraints. These additional documents were not yet available for inclusion in the quarterly tabulation of data on designated target dates.
Annual final tables are presented in Tables 1 to 7, while quarterly final tables are presented in Tables 8 to 11.
Scope and Coverage
Construction statistics from approved building permits relate to administrative-based data on new constructions and additions, alterations and repairs of existing residential and non-residential buildings and other structures proposed to be constructed in all cities/municipalities of the country in a specific period.
Sources of Information
Construction statistics are compiled by the Philippine Statistics Authority (PSA) from the copies of original application forms of approved building permits as well as from the demolition and fencing permits collected every month by PSA field personnel from the Offices of Local Building Officials (LBOs) nationwide.
Limitations of Data
- Data on building constructions refer to those approved applications during the reference period and not to construction work completed during the reference period.
- The completeness of the number of building permits collected relies on the approval of applications filed with the LBOs. Hence, building constructions without approved building permits are excluded in the tabulation of data.
Geographic Classification
Building constructions are classified and presented by geographic area using the Philippine Standard Geographic Classification (PSGC) as of December 2017. The PSGC is a systematic classification and coding of geographic areas of the Philippines. The PSGC contains the latest updates on the official number of regions, provinces, cities, municipalities and barangays in the Philippines.
Industry Classification
Construction statistics utilizes the 2009 Philippine Standard Industrial Classification (PSIC) to identify the industrial classification of the structure proposed for construction through its use or character of occupancy.
Collection
The number of building permit forms accomplished by the applicant comes in five (5) copies. The “NSO copy” of the approved building permit is made available within the first five (5) working days after each reference month. Collections of these documents from the LBO under a certain city/municipality are undertaken by PSA field personnel within this period.
Collected documents for each month are properly checked as to its completeness by verifying the beginning and ending numbers indicated in the permit numbers. Missing numbers are indicated, with corresponding reasons, in the transmittal. In cases where there is no construction in a given month in a municipality, a certification that there was no approved building permit during the reference period is provided by the LBO to the PSA field staff.
Data Processing
Copies of documents collected from the offices of LBOs are properly controlled, sorted, edited and coded, folioed and encoded in the PSA provincial offices. Collected approved building permits undergo manual and machine processing both at the Central Office (CO) and Field Office (FO). The collected documents are kept at the FO while data files are forwarded to CO.
Manual processing includes receipt and control, editing and coding while machine processing includes data encoding, data merging, data validation and generation of statistical tables. Both the CO and FO utilize the Building Permit Computer System (BPCS) for machine processing of documents. The CO is responsible for validation, consolidation and generation of preliminary tables. During machine validation, inconsistent and invalid entries which are flagged in an error listing are corrected in the data file.
Data files received after the cut-off dates of submission set for each quarter are included in the generation of annual tables. Preliminary results are based from data files that have undergone data processing in the provincial offices and have been validated at the CO. The preliminary tables are revised to include building permit documents received after the cut-off period in the annual tabulation.
Statistics Generated
Construction statistics generated from approved building permits provide monthly administrative-based data on building construction at the municipality level nationwide. Statistics generated are the following:
- number
- floor area
- type of construction
- value of construction
Statistical Tables
The statistical tables are presented at the regional and provincial levels by type of construction and by period according to form of ownership.
Unpublished Data
Aside from the preliminary tables posted in the PSA website, annual, quarterly and monthly statistical tables at the municipality level by type of construction and by form of ownership are available at the Industry Statistics Division (ISD) under the Economic Sector Statistics Service (ESSS) of the PSA.
Other special tabulations may also be made available upon request, addressed to the Undersecretary, National Statistician and Civil Registrar General, Philippine Statistics Authority, 2nd Floor PSA-Tam Building PSA Complex, East Avenue, Diliman, Quezon City.
Dissemination
Preliminary and final results of construction statistics generated from approved building permits are made public in the form of Quarterly Special Releases posted in the PSA website (www.psa.gov.ph) 60 days after the reference quarter and Annual Special Release, eight months after the reference year, respectively. The Quarterly Special Releases are reports containing the preliminary results of construction statistics generated 60 days after the reference quarter while the Annual Special Release is a consolidated report of the quarterly preliminary data incorporating documents which are submitted after the cut-off dates for each quarter.
Definition of Terms (Adopted from the Revised and Updated IRR of the National Building Code)
Building permit is a written authorization granted by the LBO to an applicant allowing him to proceed with the construction of a specific project after plans, specifications and other pertinent documents have been found to be in conformity with the National Building Code (PD 1096).
Building refers to any independent, free-standing structure comprised of one or more rooms or other spaces, covered by a roof and enclosed with external walls or dividing walls, which extend from the foundation to the roof.
Construction refers to all on-site work done from site preparation, excavation, foundation, assembly of all the components and installation of utilities, machineries and equipment of buildings/structures.
Residential building is a building for which its major parts or more than half of its gross floor area is built for dwelling purposes. This type of building can be of the single type, duplex, an apartment and/or accessoria and residential condominium.
Single house is a complete structure intended for a single family or household, i.e. bungalow, 2-storey house, nipa hut.
Duplex house is a structure intended for two households, with complete living facilities for each; it is a single structure divided into two dwelling units by a wall extending from the floor to the ceiling.
Apartment is a structure, usually of two storeys, made up of independent living quarters, with independent entrances from internal walls and courts.
Accesoria is a one or two-floor structure divided into several dwelling units, each dwelling unit having its own separate entrance from the outside.
Residential condominium is a structure, usually of several storeys, consisting of multiple dwelling units.
Other residential construction consists of school or company staff houses, living quarters for drivers and maids, and guardhouses.
Non-residential building includes commercial, industrial, agricultural and institutional buildings.
Commercial buildings refer to office buildings and all buildings which are intended for use primarily in wholesale, retail and service trades; i.e. stores, hotels, restaurants, banks, disco houses, etc.
Industrial buildings are all buildings used to house the production, assembly and warehousing activities of industrial establishments; i.e. factories, plants, mills, repair shops, machine shops, printing press, storage plant, electric generating plants.
Institutional buildings are buildings which primarily engaged in providing educational instructions and hospital/health care; ports, airports and other government buildings; i.e. school, museums, libraries, sanitaria, churches, hospitals.
Agricultural buildings are buildings used to house livestocks, plants and agricultural products such as barn, poultry house, piggeries, stables, greenhouses and grain mill.
Other non-building constructions include cemetery structures, street furniture, waiting sheds, communication towers, etc.
Addition refers to any new construction which increases the height or area of an existing building/structure.
Repair is a remedial work done on any damaged or deteriorated portion/s of a building/structure to restore its original condition.
Renovation is any physical change made on structures to increase the value, quality and to improve the aesthetic.
Alteration is a construction in a building/structure involving changes in the materials used, partitioning and location/size of openings, structural parts, existing utilities and equipment but does not increase the overall area thereof.
Conversion is a change in the use or occupancy of structure or any portion thereof, which has different requirements.
Demolitions refer to the systematic dismantling or destruction of a building/structure, in whole or in part.
Street furniture are street structures consisting of monuments, waiting sheds, benches, plant boxes, lampposts, electric poles and telephone poles.
Floor area of building refers to the sum of the area of each floor of the building measured to the outer surface of the outer walls including the area of lobbies, cellars, elevator shafts and all communal spaces in multi-dwellings. Areas of balconies are excluded.
Total value of construction refers to the sum of the cost of building, electrical, mechanical, plumbing, and others. The value is derived from the approved building permit and represents the estimated value of the building or structure when completed.