
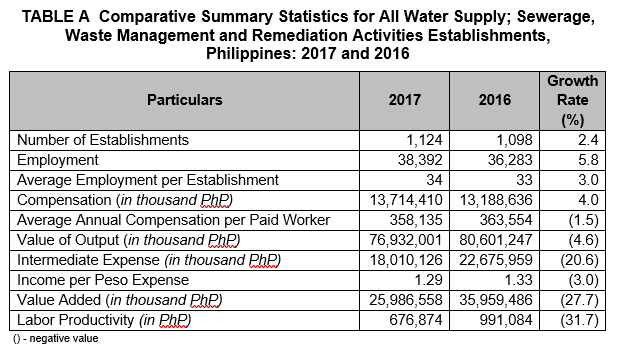
Water collection, treatment and supply industry dominates the sector in terms of number of establishments
The Annual Survey of Philippine Business and Industry (ASPBI) final results showed that a total of 1,124 establishments in the formal sector of the economy were engaged in water supply; sewerage, waste management and remediation activities in 2017. This represents a 2.4 percent increase from the 1,098 total establishments reported in 2016. (Table A)
Water collection, treatment and supply recorded the highest share of 87.9 percent to the total number of establishments for the sector. This was followed by materials recovery with 5.8 percent establishments and sewerage with 2.7 percent establishments. On the other hand, waste treatment and disposal recorded the least share of 1.5 percent. (Figure 1)
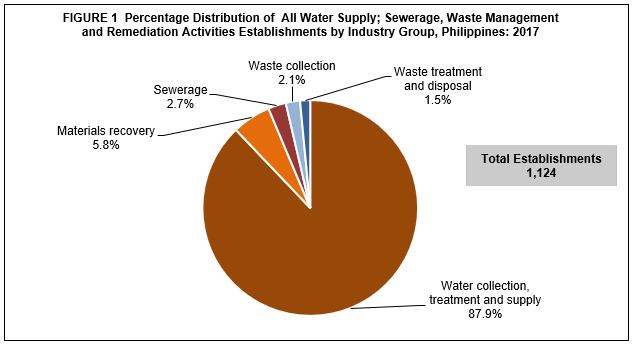
Water collection, treatment and supply industry employs the highest number of workers
The sector’s total employment in 2017 was estimated at 38,392 workers, an increase of 5.8 percent from the 36,283 total workers in 2016. (Table A)
At the industry level, water collection, treatment and supply, which recorded the highest number of establishments in 2017, was also the top industry in terms of number of workers. It employed a total of 34,748 workers or 90.5 percent of the total employment. Waste treatment and disposal, on the other hand, had the lowest number of workers which comprised 1.6 percent of the total.(Figure 2)
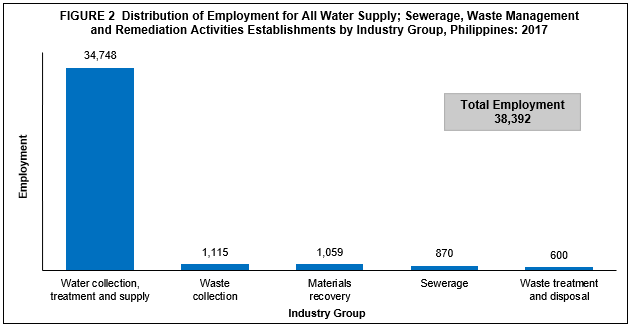
Workers in water collection, treatment and supply industry earns the highest
The total compensation paid to workers of the sector in 2017 amounted to PhP13.7 billion, which translates to an average annual compensation of PhP358,135 per paid worker. Compared with the average annual pay of PhP363,554 per paid worker in 2016, the average annual pay in 2017 decreased by 1.5 percent. (Table A)
Among industries, water collection, treatment and supply paid the highest average annual compensation of PhP372,727 per paid worker in 2017. This was followed by waste treatment and disposal, and waste collection with average annual pay of PhP308,030 and PhP221,283 per paid worker, respectively. On the other hand, workers in materials recovery were paid the lowest at PhP170,385 paid per worker. (Figure 3)
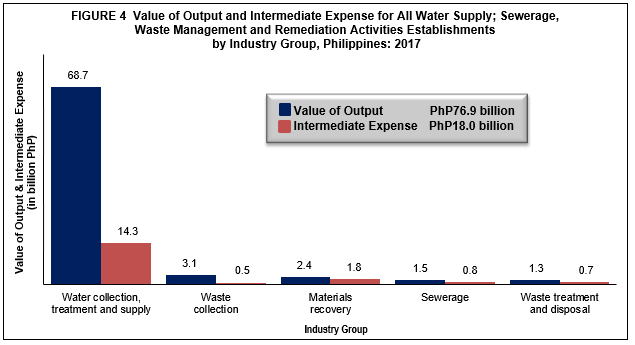
Water collection, treatment and supply industry contributes the highest share to total value of output and total intermediate expense
The total value of output generated by the sector for all establishments amounted to PhP76.9 billion in 2017, a decline of 4.6 percent from the PhP80.6 billion value of output in 2016. At the industry level, water collection, treatment and supply contributed the biggest share to total value of output which amounted to PhP68.7 billion. On the contrary, waste treatment and disposal posted the smallest share amounting to PhP1.3 billion. (Figure 4 and Table A)
The total intermediate expense incurred by the sector was recorded at PhP18.0 billion, lower by 20.6 percent than the PhP22.7 billion total intermediate expense in 2016. At the industry level, water collection, treatment and supply recorded the highest intermediate expense which amounted to PhP14.3 billion. Conversely, waste collection incurred the lowest intermediate expense of PhP0.5 billion. (Figure 4)
Sewerage records the highest return
Income per peso expense for the sector was recorded at 1.29 in 2017. This reflects a decrease of 3.0 percent compared with the income per peso expense of 1.33 in 2016. (Table A)
Among industry groups, sewerage recorded the highest income per peso expense of 1.49. This was followed by water collection, treatment and supply with income per peso expense of 1.31. The income per peso expense of other industries were as follows:
• Waste collection, 1.15
• Materials recovery, 1.14
• Waste treatment and disposal, 1.08
(Table 1a)
Value added amounts to PhP26.0 billion
The total value added generated by all establishments of the sector was estimated at PhP26.0 billion in 2017. This represents a decrease of 27.7 percent from the PhP36.0 billion value added in 2016. (Table A)
Water collection, treatment and supply contributed the biggest share of 91.1 percent to total value added while waste treatment and disposal had the smallest share of 1.3 percent. (Table 1)
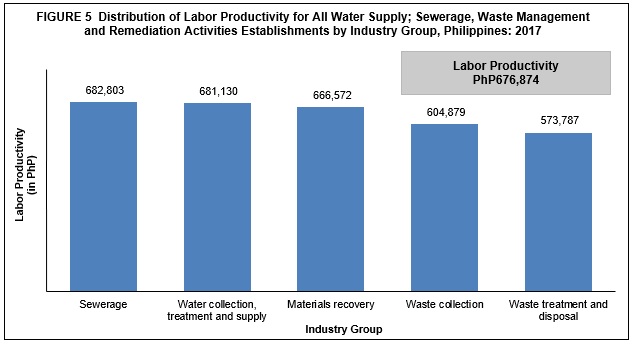
Sewerage industry records the highest labor productivity
Labor productivity, which is the ratio of value added to total employment, was estimated at PhP676,874 per worker in 2017. This represents a decrease of 31.7 percent from the labor productivity of PhP991,084 per worker in 2016. (Table A)
Among industries, sewerage led the sector with labor productivity of PhP682,803 per worker. On the other hand, waste treatment and disposal reported the lowest labor productivity of PhP573,787 per worker. (Figure 5)
Government grants PhP128.0 million worth of subsidy
The total subsidies granted by the government to support the business operations of the sector in 2017 amounted to PhP128.0 million, lower by 52.4 percent than the PhP268.8 million subsidies in 2016. All the subsidies received by the sector went to water collection, treatment and supply industry. (Table 1)
(Sgd.) ROSALINDA P. BAUTISTA
Assistant Secretary
Deputy National Statistician
Sectoral Statistics Office
TECHNICAL NOTES
Introduction
This Special Release presents the final results of the 2017 Annual Survey of Philippine Business and Industry (ASPBI) for all Water Supply; Sewerage, Waste Management and Remediation Activities establishments (Sector E).
The 2017 ASPBI is one of the designated statistical activities of the Philippine Statistics Authority (PSA). Data collected from the survey provide information on the levels, structure, performance and trends of economic activities of the formal sector in the entire country for the year 2017.
The survey was conducted nationwide in 2018 with the year 2017 as the reference period of data, except for employment which is as of 15 November 2017.
Establishment Data Management System (EDMS) was utilized in the decentralized processing of the ASPBI questionnaires in the provinces as well as in the online accomplishment of questionnaires through the PSA website.
Data are presented by industry group or 3-digit level of the 2009 Philippine Standard Industrial Classification (PSIC) at the national level.
Data are also generated at the regional level.
Legal Authority
The conduct of the 2017 ASPBI is authorized under Republic Act 10625 known as the Philippine Statistical Act of 2013 - which mandates reorganizing and strengthening of the Philippine Statistical System (PSS), its agencies and instrumentalities.
Scope and Coverage
The 2017 ASPBI covered establishments engaged in 18 economic sectors classified under the 2009 PSIC, namely:
• Agriculture, Forestry and Fishing (A)
• Mining and Quarrying (B)
• Manufacturing (C)
• Electricity, Gas, Steam, and Air Conditioning Supply (D)
• Water Supply; Sewerage, Waste Management and Remediation Activities (E)
• Construction (F)
• Wholesale and Retail Trade; Repair and Maintenance of Motor Vehicles, Motorcycles(G)
• Transportation and Storage (H)
• Accommodation and Food Service Activities (I)
• Information and Communication (J)
• Financial and Insurance Activities (K)
• Real Estate Activities (L)
• Professional, Scientific and Technical Activities (M)
• Administrative and Support Service Activities (N)
• Education (P)
• Human Health and Social Activities (Q)
• Arts, Entertainment and Recreation (R)
• Other Service Activities (S)
The survey was confined to the formal sector of the economy, which consists of the following:
• Corporations and partnership
• Cooperatives and foundations
• Single proprietorship with employment of 10 and over
• Single proprietorships with branches
Hence, the 2017 ASPBI covered only the following economic units:
• All establishments with total employment (TE) of 10 and over, and;
• All establishments with TE of less than 10, except those establishments with Legal Organization = 1 (single proprietorship) and Economic Organization = 1 (single establishment), that are engaged in economic activities classified according to the 2009 Philippine Standard Industrial Classification (PSIC).
Frame of Establishments
The frame for the 2017 ASPBI was extracted from the 2017 List of Establishments (LE). The estimated number of establishments in operation in the country in 2017 totaled to 917,582. About 228,112 (24.9%) establishments comprised the establishment frame or are within the scope and coverage of the 2017 ASPBI.
Unit of Enumeration
The unit of enumeration for the 2017 ASPBI is the establishment. An establishment is defined as an economic unit under a single ownership or control which engages in one or predominantly one kind of activity at a single fixed location.
Classification of Establishments
An establishment is categorized by its economic organization, legal organization, industrial classification, employment size, and geographic location.
Economic Organization refers to the organizational structure or role of the establishment in the organization. An establishment may be single establishment, branch, establishment and main office with branches elsewhere, main office only, and ancillary unit other than main office.
Legal Organization refers to the legal form of the economic entity which owns the establishment. An establishment may be single proprietorship, partnership, government corporation, stock corporation, non-stock corporation, and cooperative.
The industrial classification of an economic unit was determined by the activity from which it derives its major income or revenue. The 2009 PSIC was utilized to classify economic units according to their economic activities.
The size of an establishment is determined by its TE as of a specific date.
Geographic Classification. Establishments are also classified by geographic area using the Philippine Standard Geographic Code (PSGC) classification.
Sampling Design
The 2017 ASPBI used stratified systematic sampling with 5-digit PSIC serving as first stratification variable and employment size as the second stratification variable.
Estimation Procedure
a. Non-Certainty Stratum (strata of TE 20 to 49 and TE 50 to 99)
The estimate of the total of a characteristic ![]() for the non-certainty employment strata in an industry domain in each region,
for the non-certainty employment strata in an industry domain in each region,
where:
s = denotes the non-certainty employment strata in TE of 20 to 99
p = 1, 2...17 regions (geographic domains)
Xspj = value of the jth establishment in the non-certainty employment strata in TE of 20 to 99 for an industry domain in each region
j = 1, 2, 3...nsp establishments
Wspj = weight of the jth establishment in non-certainty employment strata in TE of 20 to 99 for an industry domain in each region
Nsp = total number of establishments in the non-certainty employment strata in TE of 20 to 99 for an industry domain in each region
nsp = number of sample establishments in the non-certainty employment strata in TE of 20 to 99 for an industry domain in each region
b. Certainty Stratum (TE 100 and over)
The value of the total of a characteristic (Xcp) for the certainty employment stratum in an industry domain in each region,
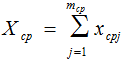
where:
c = denotes the certainty employment strata in TE 100 and over
p = 1, 2...17 regions (geographic domains)
Xcpj = value of the jth establishment in the certainty employment strata in TE 100 and over for an industry domain within each region
j = 1, 2, 3...mcp establishments
mcp = number of establishments in the certainty employment strata in TE 100 and over in an industry domain within each region
c. Total Estimate for TE of 20 and Over
The estimate of the total of a characteristic ![]() for the industry domain in each region (geographic domain) was obtained by aggregating the estimated for all employment strata (non-certainty and certainty) in the same industry domain,
for the industry domain in each region (geographic domain) was obtained by aggregating the estimated for all employment strata (non-certainty and certainty) in the same industry domain,
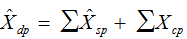
where dp denotes the industry domains in each region.
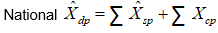
National level estimate of the characteristic by industry domain were obtained by aggregating separately the estimates ![]() for the particular industry domain from all the regions.
for the particular industry domain from all the regions.
For Establishments with TE of Less Than 20
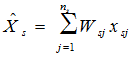
a. Non-Certainty Stratum
The estimate of the total of a characteristic ( ![]() ) for the non-certainty employment stratum TE less than 20 in the sth industry domain was
) for the non-certainty employment stratum TE less than 20 in the sth industry domain was
where:
s = denotes the non-certainty employment strata in TE of less than 20
Xsj = value of the jth establishment in non-certainty employment stratum in TE of less than 20 in Sth industry domain
j = 1, 2, 3..., ns establishments
Wsj = weight of the jth establishment in the non-certainty employment stratum of less than 20 in the sth industry domain

Ns = total number of establishments in the non-certainty employment stratum in TE of less than 20 in the sth industry domain
ns = number of sample establishments in the non-certainty employment stratum in TE of less than 20 in sth domain
Weight Adjustment Factor for Non-Response
To account for non-response in the non-certainty strata, the adjustment factors, and (n/n') was multiplied with the sampling weight (W) of each of the sampling unit. The sampling weight which is defined as N/n was recomputed as
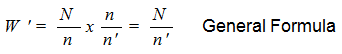
Thus, the adjusted weight (W'spj) for the non-certainty employment stratum for the industry domain with TE 20-99 was
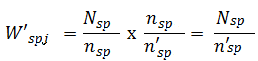
Where:
Nsp = total number of establishments in the non-certainty employment stratum with TE 20-99 for the industry domain within each geographic domain (region)
n'sp = number of responding establishments in the non-certainty employment stratum with TE of 20-99 for the industry domain within each geographic domain (region)
Response Rate
Response rate for all water supply; sewerage, waste management and remediation activities establishments was 91.6 percent (601 out of 656 establishments). This included receipts of "good" questionnaires, partially accomplished questionnaires, reports of closed, moved out or out of scope establishments.
Of the total responses, 47 establishments responded online.
Reports of the non-reporting establishments were sourced from the financial statements available at the Securities and Exchange Commission (SEC) website and from other available administrative data sources. Reports of establishments which were found to be duplicate of another establishment, out-of-scope and out of business in 2017 were not included in the generation of statistical tables.
Limitation of Data
The survey covered only the formal sector of the economy.
Concepts and Definitions of Terms
Change in inventories is equivalent to the value of inventories at the end of the year less the value of inventories at the beginning of the year.
Compensation is the sum of salaries and wages, separation/retirement/terminal pay, gratuities, and payments made by the employer in behalf of the employees such as contribution to SSS/GSIS, ECC, PhilHealth, Pag-ibig, etc.
E-commerce refers to the selling of products or services over electronic systems such as Internet Protocol-based networks and other computer networks. Electronic Data Interchange (EDI) network or other online system. Excluded are orders received from telephone, facsimile and e-mails.
Economic activity is the establishment’s source of income. If the establishment is engaged in several activities, its main economic activity is that which earns the biggest income or revenue.
Establishment is defined as an economic unit under a single ownership or control which engages in one or predominantly one kind of activity at a single fixed location.
Expense refers to cost incurred in an enterprise effort to generate revenue, representing the cost of doing business. This is treated on a consumed basis. It excludes cost incurred in the acquisition of income generating assets.
Gross addition to tangible fixed assets is equal to capital expenditures less sale of fixed assets, including land.
Income or Revenue refers to cash received and receivables for goods/products and by-products sold and services rendered.
Intermediate expense are expenditures incurred in the production of goods such as materials and supplies used; fuels, lubricants, oils and greases used; electricity and water purchased, and industrial services done by others.
Paid workers are all persons working in the establishment and receiving pay, as well as those working away from the establishment paid by and under the control of the establishment. Included are all employees on sick leave, paid vacation or holiday. Excluded are consultants, home workers, receiving pure commissions only, and workers on indefinite leave.
Salaries and wages are payments in cash or in kind to all employees, prior to deductions for employee’s contributions to SSS/GSIS, withholding tax, etc. Included are total basic pay, overtime pay and other benefits.
Subsidies are all special grants in the form of financial assistance or tax exemption or tax privilege given by the government to aid and develop an industry.
Total employment is the number of persons who worked in or for the establishment as of 15 November 2017.
Value added is gross output less intermediate input. Gross output for the water supply; sewerage, waste management and remediation activities sector is value of output plus income from non-industrial services done for others (except rent income from land). Intermediate input is intermediate expense plus expense for non-industrial services done by others (except rent expense for land) and all other expenses.
Value of output represents the sum of the receipts from revenue from main activity, income from industrial services done for others, goods sold in the same condition as purchased less the cost of goods sold and value of fixed assets produced on own account.
| Attachment | Size |
|---|---|
|
|
13.43 KB |
|
|
12.79 KB |