
TABLE A Comparative Summary Statistics for Accommodation and Food Service Establishments with Total Employment of 20 and Over: Philippines, 2017 and 2016

Restaurants and mobile food service activities industry posts highest number of establishments
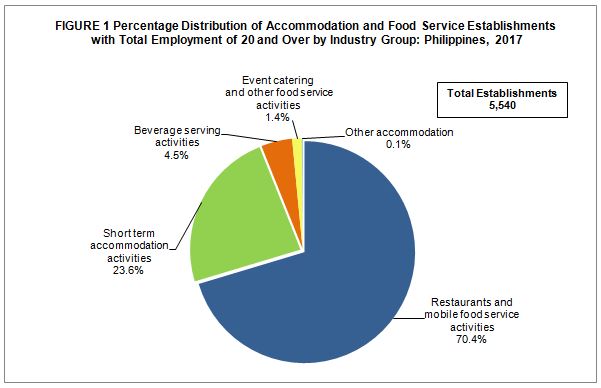
Based on the preliminary results of the 2017 Annual Survey of Philippine Business and Industry (ASPBI), there were 5,540 establishments with total employment (TE) of 20 and over in the formal sector of the economy that were engaged in accommodation and food service activities. The number of establishments in 2017 decreased by 7.3 percent compared with the 5,978 establishments in 2016.
By industry, majority of the establishments with TE of 20 and over were engaged in restaurants and mobile food service activities numbering to 3,898 or 70.4 percent of the total. This was followed by short term accommodation activities with 1,306 establishments (23.6%), and beverage serving activities with 252 establishments (4.5%). On the other hand, other accommodation recorded the least number of establishments of six or 0.1 percent.
The percentage distribution of establishments with TE of 20 and over engaged in accommodation and food service activities by industry group in 2017 is shown in Figure 1.
Among the regions, the National Capital Region (NCR) had the most number of establishments of 2,230 or40.3 percent of the total. CALABARZON and Central Luzon placed second and third with 658 establishments (11.9%) and 536 establishments (9.7%), respectively.
Restaurants and mobile food service activities industry generates highest employment
Total employment of establishments with TE of 20 and over reached 249,490 workers in 2017. Of the total, 248,545 or 99.6 percent were paid employees and the remaining were working owners and unpaid workers. The total employment in 2017 decreased by 12.4 percent compared with the 284,813 workers inthe previous year.
Across industries, restaurants and mobile food service activities employed the highest number of workers of 152,276 or 61.0 percent of the total. Short term accommodation activities followed with 84,679 workers or 33.9 percent. Beverage serving activities came third with 7,723 workers (3.1%).
Figure 2 presents the distribution of employment for establishments with TE of 20 and overand engaged in accommodation and food service activities by industry group in 2017.

Across regions, NCR emerged as the top employer, generating jobs for 97,493 workers (39.1%). CALABARZON followed with 27,952 workers or 11.2 percent and Central Visayas with 27,524 workers (11.0%).
The average number of workers was recorded at 45 per establishment. Short term accommodation activities posted the highest average number of workers of 65 per establishment, followed by event catering and other food service activities with an average of 59 workers per establishment.
Short term accommodation activities industry pays the highest average annual compensation
In 2017, the sector paid a total compensation to its employees amounting to PHP44.1 billion. This translates to an average annual compensation per paid employee of PHP177.5 thousand, lower by 1.8 percent compared with the PHP180.8 thousand compensation recorded in 2016.
Among the industries, short term accommodation activities paid the highest average annual compensation of PHP231.0 thousand per paid employee. This was followed by event catering and other food service activities and restaurants and mobile food service activities, paying PHP189.6 thousand and PHP150.2 thousand per paid employee, respectively.
Figure 3 displays the average annual compensation of paid employees for establishments with TE of 20 and over and engaged in accommodation and food service activities by industry group in 2017.

By region, establishments located in NCR paid the highest average annual compensation of PHP230.2 thousand per paid employee. This was followed by Central Visayas paying PHP172.4 thousand per paid employee. Completing the top three regions in terms of average annual compensation was Western Visayas, spending PHP152.7 thousand per paid employee. On the other hand, Caraga paid the lowest average annual compensation of PHP103.8 thousand per paid employee.
Restaurants and mobile food service activities contributes the biggest share to total income and expense
The total income generated by the sector was estimated at PHP306.4 billion in 2017, a decrease of 19.3 percent from the PHP379.5 billion income in 2016.
Restaurants and mobile food service activities accounted for the highest share to income amounting to PHP166.6 billion or 54.4 percent of the total income. This was followed by short term accommodation activities with PHP127.8 billion income or 41.7 percent.
At the regional level, NCR accounted for almost half (49.4%) of the total income amounting to PHP151.5 billion. Central Visayas and CALABARZON followed with income of PHP32.0 billion (10.5%) and PHP27.7 billion (9.1%), respectively.
The total expense incurred in business operation amounted to PHP247.3 billion in 2017, a 24.2 percent decrement compared with the PHP326.4 billion total expense in 2016.
Restaurants and mobile food service activities had the highest contribution to total expense amounting to PHP139.7 billion or 56.5 percent. This was followed by short term accommodation activities and beverage serving activities with corresponding expenses of PHP97.4 billion (39.4%) and PHP5.3 billion(2.1%).
Among the regions, NCR incurred the highest expense of PHP119.2 billion (48.2%). This was followed by Central Visayas with expense worth PHP26.6 billion (10.7%) and CALABARZON, PHP23.2 billion (9.4%). These regions were also the regions with the highest income.
The income generated per peso expense of establishments with TE of 20 and over stood at 1.24. Among the industries, short term accommodation activities recorded the highest income per peso expense of 1.31.Next was event catering and other food service activities with income per peso expense of 1.23 and restaurants and mobile food service activities, 1.19.
By region, Northern Mindanao recorded the highest income per peso expense of 1.60.
Value added reaches PHP116.4 billion
The total value added generated by establishments with TE of 20 and over was recorded at PHP116.4 billion in 2017, lower by10.9 percent compared with the previous years value added of PHP130.6 billion.
By industry, restaurants and mobile food service activities generated the highest value added of PHP59.9 billion (51.5%). This was followed by short term accommodation activities with PHP52.5 billion (45.1%).On third place was event catering and other food service activities with PHP2.1 billion (1.8%).
The top three regions generated more than two-thirds (68.7%) of the total value added. On top was NCR with PHP55.8 billion (47.9%) worth of value added. Central Visayas with PHP13.7 billion (11.7%) and CALABARZON with PHP10.5 billion (9.0%) ranked second and third, respectively. Autonomous Region in Muslim Mindanao (ARMM) contributed the least value added amounting to PHP44.9 million (0.04%).
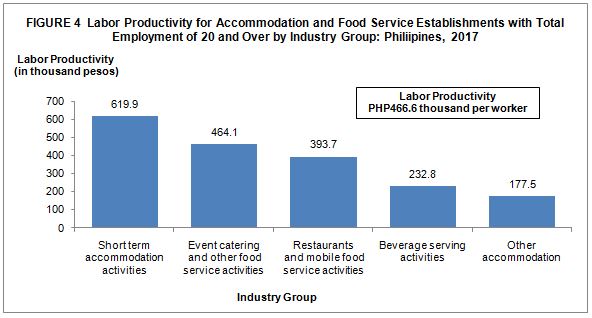
Labor productivity, defined as the ratio of value added to total employment, was estimated at PHP466.6 thousand per worker in 2017. This value was higher by 1.8 percent from the labor productivity in 2016 of PHP458.5 thousand per worker.
Among industry group, the highest labor productivity was generated by short term accommodation activities at PHP619.9 thousand per worker. This was followed by event catering and other food service activities with labor productivity of PHP464.1 thousand per worker. Restaurants and mobile food service activities with labor productivity of PHP393.7 thousand per worker ranked third. On the other hand, other accommodation recorded the least labor productivity ofPHP177.5 thousand per worker.
Figure 4 shows the labor productivity for establishments with TE of 20 and over and engaged in accommodation and food service activities by industry group in 2017.
Among the regions, Northern Mindanao posted the highest labor productivity of PHP731.6 thousand per worker. NCR and Central Visayas followed with labor productivity of PHP572.3 and PHP496.0 thousand per worker, respectively.
Short term accommodation industry accounts for 97.3 percent of the total e-commerce sales
The recorded sales from e-commerce transactionsof establishments with TE of 20 and over in 2017 amounted to PHP5.582 billion, a slight decline of 0.05 percent compared with the PHP5.579 billion salesin 2016.
In 2017, only two industries generated sales through e-commerce. These were short term accommodation activities and restaurants and mobile food service activities with e-commerce sales of PHP5.4 billion (97.3%) and PHP151.9 million (2.7%), respectively.
By region, NCR generatedmore than half (54.6%) of the total sales from e-commerceamounting to PHP3.0 billion. Central Visayas and Central Luzon recordedan e-commerce sales of PHP1.1 billion (20.4%) and PHP609.6 million (10.9%), respectively.

TECHNICAL NOTES
Introduction
This Special Release presents the preliminary results of the 2017 Annual Survey of Philippine Business and Industry (ASPBI) for Accommodation and Food Service Activities sector for establishmentswith total employment of 20 and over.
The ASPBI is one of the designated statistical activities of the Philippine Statistics Authority (PSA). Data collected from the survey provide information on the levels, structure, performance, and trends of economic activities of the formal sector in the entire country in2017.
The survey was conducted nationwide in 2018 with 2017 as the reference period of data, except for employment which is as of 15 November 2017.
The Establishment Data Management System (EDMS) was utilized in the decentralized processing of survey returns in the provinces as well as in the online accomplishment of questionnaires through the PSA website.
Data are presented by industry group or 3-digit of the 2009 Philippine Standard Industrial Classification (PSIC) at the national and regional level.
Legal Authority
The conduct of the 2017 ASPBI is authorized under Republic Act 10625, known as the Philippine Statistical Act of 2013, which mandates reorganizing and strengthening of the Philippine Statistical System (PSS), its agencies and instrumentalities.
Scope and Coverage
The 2017 ASPBI covered establishments engaged in 18 economic sectors classified under the 2009 PSIC, namely:
• Agriculture, Forestry and Fishing (A)
• Mining and Quarrying (B)
• Manufacturing (C)
• Electricity, Gas, Steam, and Air Conditioning Supply (D)
• Water Supply; Sewerage, Waste Management and Remediation Activities (E)
• Construction (F)
• Wholesale and Retail Trade;Repair of Motor Vehicles and Motorcycles (G)
• Transportation and Storage (H)
• Accommodation and Food Service Activities (I)
• Information and Communication (J)
• Financial and Insurance Activities (K)
• Real Estate Activities (L)
• Professional, Scientific and Technical Activities (M)
• Administrative and Support Service Activities (N)
• Education (P)
• Human Health and Social Work Activities (Q)
• Arts, Entertainment and Recreation (R)
• Other Service Activities (S)
The survey was confined to the formal sector of the economy, which consists of the following:
• Corporations and partnership
• Cooperatives and foundations
• Single proprietorship with employment of 10 and over
• Single proprietorships with branches
Hence, the 2017 ASPBI covered only the following economic units:
• All establishments with total employment (TE) of 10 or more, and;
• All establishments with TE of less than 10, except those establishments with Legal Organization = 1 (single proprietorship) and Economic Organization = 1 (single establishment), that are engaged in economic activities classified according to the 2009 Philippine Standard Industrial Classification (PSIC).
Frame of Establishments
The frame for the 2017 ASPBI was extracted from the 2017 List of Establishments (LE). The estimated number of establishments in operation in the country in 2017 totaled to 917,582. About 228,112 establishments (24.9%) of the total establishments comprise the establishment frame or are within the scope and coverage of the 2017 ASPBI.
Unit of Enumeration
The unit of enumeration for the 2017 ASPBI is the establishment. An establishment is defined as an economic unit under a single ownership or control which engages in one or predominantly one kind of activity at a single fixed location.
Taxonomy of Establishments
An establishment is categorized by its economic organization, legal organization, industrial classification, employment size, and geographic location.
Economic Organization refers to the organizational structure or role of the establishment in the organization. An establishment may be single establishment, branch, establishment and main office with branches elsewhere, main office only, and ancillary unit other than main office.
Legal Organization refers to the legal form of the economic entity which owns the establishment. An establishment may be single proprietorship, partnership, government corporation, stock corporation, non-stock corporation, and cooperative.
Industrial classification of an economic unit was determined by the activity from which it derives its major income or revenue. The 2009 PSIC which was approved for adoption by government agencies and instrumentalities through NSCB Resolution No. 2 Series 2010 was utilized to classify economic units according to their economic activities.
Size of an establishment is determined by its TE as of a specific date. TE refers to the total number of persons who work in or for the establishment.
This includes paid employees, working owners, unpaid workers and all employees who work full-time or part-time including seasonal workers. Included also are persons on short term leave such as those on sick, vacation or annual leaves and on strike.
Geographic Classification refers to the grouping of establishments by geographic area using the Philippine Standard Geographic Code (PSGC) classification. The PSGC contains the latest updates on the official number of regions, provinces, cities, municipalities, and barangays in the Philippines. The PSGC as of 31 December 2017 was used for the 2017 ASPBI.
Sampling Design
The 2017 ASPBI uses a stratified systematic sampling with 5-digit PSIC serving as industry strata, and employment size as the second stratification variable.
For establishments with TE of 20 and over, the 17 administrative regions serve as the geographic domains while the 5-digit level of the 2009 PSIC serves as the industry domains.
Estimation Procedure for Establishments with TE of 20 and Over
a. Non-Certainty Stratum (strata of TE 20 to 49 and TE 50 to 99) Sections A, C, E, F, G, H, I, J, K, L, M, N, P, Q, R and S
The estimate of the total of a characteristic  ) for the non-certainty employment strata in TE of 20 and over for an industry domain in each region,
where:
s = denotes the non-certainty employment strata in TE 20 to 49 and TE 50 to 99
p= 1, 2,...,17 regions (geographic domains)
xspj= value of the jthestablishment in the non-certainty employment strata in TE 20 to 49 and TE 50 to 99for an industry domain in each region
j = 1, 2, 3,…,nspestablishments
Wspj = weight of the jth establishment in the non-certainty employment strata in TE 20 to 49 and TE 50 to 99 for an industry domain in each region

Nsp = total number of establishments in the non-certainty employment strata in TE 20 to 49 and TE 50 to 99 for an industry domain in each region
nsp = number of sample establishments in the non-certainty employment strata in TE 20 to 49 and TE 50 to 99 for an industry domain in each region
b. Certainty Stratum (Establishments under the following: Section B, D and J, ICT core industries, BPM industries, GOCCs, and with TE 20 and over)
The estimate of the total of a characteristic (X_cp) for the certainty employment stratum in an industry domain in each region,
where:
c = denotes the certainty employment strata in TE of 20 and over
p= 1, 2,...,17 regions (geographic domains)
xcpj = value of the jth establishment in the certainty employment strata in TE of 20 and over for an industry domain within each region
j = 1, 2, 3, …,mcp establishments
mcp= number of establishments in the certainty employment strata in TE of 20 and over in an industry domain within each region
c. Total Estimate for TE of 20 and Over
The estimate of the total of a characteristic  for the industry domain in each region (geographic domain) is obtained by aggregating the estimates for all employment strata (non-certainty and certainty) in the same industry domain,
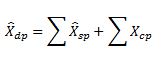
Where d denotes the industry domains and p refers to region.
National level estimates of the characteristics by industry domain were obtained by aggregating separately the estimates  for the particular industry domain from all the regions.
Weight Adjustment Factor for Non-Response
To account for non-response in the non-certainty strata, the adjustment factor (n/n’) was multiplied with the sampling weight (W) of each of the sampling unit. The sampling weight, defined as N/n, was recomputed as

Thus, the adjusted weight (W’ spj) for the non-certainty employment stratum for the industry domain with TE 20-99 was
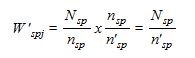
where:
Nsp = total number of establishments in the non-certainty employment stratum with TE 20-99 for the industry domain within each geographic domain (region)
n’sp = number of responding establishments in the non-certainty employment stratum with TE 20-99 for the industry domain within each geographic domain (region)
Response Rate
The response rate for Accommodation and Food Service Activities sector for establishments with TE of 20 and over was 88.9 percent (1,003 out of 1,128establishments). This included receipts of "good" questionnaires, partially accomplished questionnaires, reports of closed, moved out or out of scope establishments.
Of the total responses, 21 establishments responded online.
Reports of the remaining non-reporting establishments were taken from financial statements from Securities and Exchange Commission (SEC) and other available sources. Reports of establishments which were found to be duplicate of another establishment’s report, out-of-scope, and out of business in 2017 were not included in the generation of statistical tables.
Limitation of Data
Only the formal sector was covered in the survey.
Concepts and Definitions of Terms
Change in inventories is equivalent to the value of inventories at the end of the year less the value of inventories at the beginning of the year.
Compensation is the sum of salaries and wages, separation/retirement/terminal pay, gratuities, and payments made by the employer in behalf of the employees such as contribution to SSS/GSIS, ECC, PhilHealth, Pag-ibig, etc.
E-commerce refers tothe selling of products or services over electronic systems such as Internet Protocol-based networks and other computer networks. Electronic Data Interchange (EDI) network, or other on-line system. Excluded are orders received from telephone, facsimile and e-mails.
Economic activity is the establishment’s source of income. If the establishment is engaged in several activities, its main economic activity is that which earns the biggest income or revenue.
Establishment is an economic unit under a single ownership and control, i. e. under a single entity, engaged in one or predominantly one kind of economic activity at a single fixed location.
Expense refers to the cost incurred by the establishment during the year whether paid or payable. This is treated on a consumed basis. Valuation is at purchaser price including taxes and other charges, net of rebates, returns and allowances. Goods and services received by the establishment from other establishments of the same enterprise are valued as though purchased.
Gross addition to tangible fixed assets is equal to capital expenditures less sale of fixed assets, including land.
Income or Revenue refers tocash received and receivables for goods/products andby-products sold and services rendered. Valuation is at producer prices (ex-establishment) net of discounts and allowances, including duties and taxes but excluding subsidies.
Inventories refer to the stock of goods owned by and under the control of the establishment as of a fixed date, regardless of where the stocks are located. Valuation is at current replacement cost in purchaser prices. Replacement cost is the cost of an item in terms of its present price rather than its original cost.
Paid employees are all persons working in the establishment and receiving pay, as well as those working away from the establishment paid by and under the control of the establishment. Included are all employees on sick leave, paid vacation or holiday. Excluded are consultants, home workers, receiving pure commissions only, and workers on indefinite leave.
Salaries and wages are payments in cash or in kind to all employees, prior to deductions for employee’s contributions to SSS/GSIS, withholding tax, etc. Included are total basic pay, overtime pay and other benefits.
Subsidies are special grants in the form of financial assistance or tax exemption or tax privilege given by the government to aid and develop an industry.
Total employment is the number of persons who worked in for the establishment as of 15 November 2017.
Value added is gross output less intermediate input. Gross output for Accommodation and Food Service Activities sectoris the sum of income from service rendered, real estate sales less real estate sold, commissions and fees earned, income from renting and leasing services of real estate properties,income from non-industrial service done for others (less rent income from land), sales of goods (less cost of goods sold), grants and donations, other income,capital expenditures of fixed assets produced on own account and change in inventories. Intermediate input is the sum of the following expense items: materials and supplies purchased; fuels, lubricants, oils and greases purchased; electricity purchased, water purchased; industrial services done by others; non-industrial services done by others (less rent expense for land); goods purchased for resale; research and development expense; environmental protection expense; royalty fee; franchise fee; payouts and other expense.
See more at the Annual Survey of Philippine Business and Industry (ASPBI) page.