
Internet access in facilities open to the public service activities industry posts the highest in terms of number of establishments
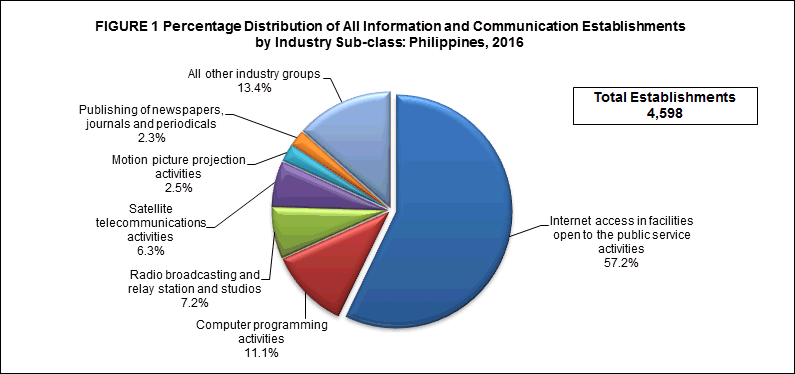
The final results of the 2016 Annual Survey of Philippine Business and Industry (ASPBI) reported a total of 4,598 establishments in the formal sector of the economy engaged in information and communication activities.
Internet access in facilities open to the public service activities recorded the highest number of establishments with 2,629 or 57.2 percent of the total for the sector. Computer programming activities, and radio broadcasting and relay station and studios placed afar second and third with 512 establishments (11.1%) and 329 establishments (7.2%), respectively. Other industries with more than a hundred in number of establishments were the following:
- Satellite telecommunications activities, 290 establishments (6.3%)
- Motion picture projection activities, 115 establishments (2.5%)
- Publishing of newspapers, journals and periodicals, 105 establishments (2.3%)
Figure 1 shows the percentage distribution of all information and communication establishments by industry sub-class in 2016.
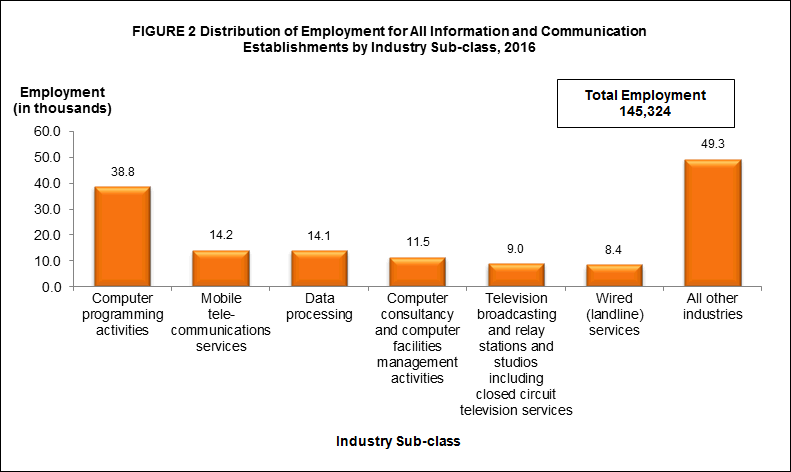
Computer programming activities industry records the highest number of workers
A total of 145,324 workers were hired by establishments engaged in information and communication activities in 2016, in which 143,565 were paid and the rest were working owners or unpaid workers.
Computer programming activities had the most number of workers with 38,808 workers or 26.7 percent of the total employment. This was followed by mobile telecommunications services with 14,176 workers (9.8%). Data processing placed third with 14,052 workers (9.7%).
Figure 2 shows the distribution of employment of the sector for all information and communication establishments by industry sub-class in 2016.
A national average of 32 workers per establishment was recorded for all information and communication establishments during the survey year. Mobile telecommunications services registered the highest among industries with an average of 1,418 workers per establishments. Other industries with more than 150 workers per establishment were the following:
- Publishing of directories and mailing lists, 419 workers per establishment
- Software publishing, 370 workers per establishment
- Data processing, 293 workers per establishment
- Wired (landline) services, 216 workers per establishment
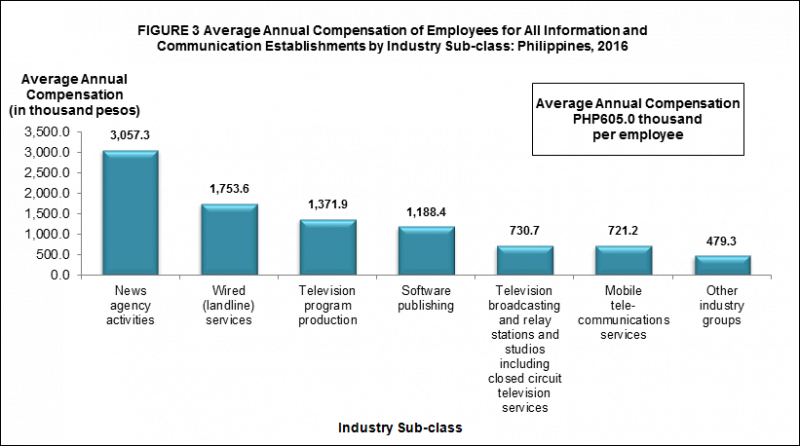
Employees in the news agency activities industry are the highest-paid
In 2016, the sector paid a total compensation of PHP86.9 billion, translating to an average annual compensation of PHP605.0 thousand per employee.
Industry-wise, computer programming activities paid the highest compensation of PHP25.5 billion. This was followed by wired (landline) services and mobile telecommunications services paying a total compensation of PHP14.7 billion and PHP10.2 billion, respectively.
Meanwhile, employees of news agency activities received the highest average annual compensation of PHP3,057.3 thousand per employee. Wired (landline) services followed with an average annual compensation of PHP1,753.6 thousand per employee. Television program production ranked third receiving an average annual compensation of PHP1,371.9 thousand per employee.
Figure 3 shows the average annual compensation of employees for all establishments of the sector by industry sub-class in 2016.
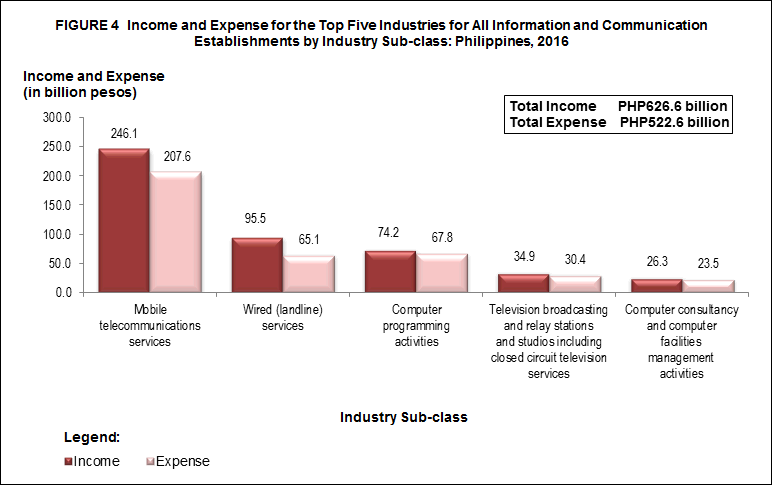
Mobile telecommunications services industry generates the biggest share in income and expense
The total income generated by the sector amounted to PHP626.6 billion in 2016. Mobile telecommunications services had the biggest share with income of PHP246.1 billion or 39.3 percent of the total for the sector. Wired (landline) services placed second with income amounting to PHP95.5 billion (15.2%) and computer programming activities ranked third with PHP74.2 billion (11.8%).
On the other hand, total expense incurred in 2016 reached PHP522.6 billion. Mobile telecommunications services, which was the highest income generator, also had the highest proportion of expense worth PHP207.6 billion or 39.7 percent of the total. Computer programming activities and wired (landline) services ranked second and third with expenses of PHP67.8 billion (13.0%) and PHP65.1 billion (12.5%), respectively.
Figure 4 shows the distribution of income and expense for the top five industries for all establishments of the sector in 2016.
Income per peso expense stands at 1.20
The generated income per peso expense of the sector stood at 1.20.
By industry sub-class, application hosting services recorded the highest income per peso expense of 1.72, followed by wired (landline) services with income per peso expense ratio of 1.47. Other wired telecommunications activities ranked third with income per peso expense ratio of 1.45.
Value added of the sector reaches PHP241.0 billion
In 2016, total value added generated by the sector amounted to PHP241.0 billion.
The top three contributors to the total value added were the following industries:
- Mobile telecommunications services, PHP76.0 billion (31.5%)
- Wired (landline) services, PHP43.6 billion (18.1%)
- Computer programming activities, PHP34.3 billion (14.2%)
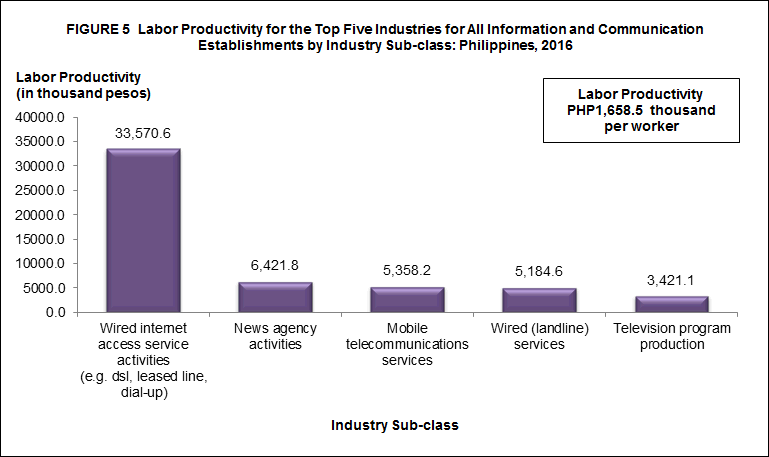
Meanwhile, value added per employment, a measure of labor productivity, was estimated at PHP1,658.5 thousand per worker. Wired internet access service activities (e.g. dsl, leased line, dial-up) recorded the highest labor productivity of PHP33,570.6 thousand per worker while internet access in facilities open to the public service activities registered the lowest, with PHP130.2 thousand per worker.
Figure 5 shows the labor productivity for the top five industries for all information and communication establishments by industry sub-class in 2016.
Gross additions to tangible fixed assets amounts to PHP53.4 billion
Gross additions to tangible fixed assets (capital expenditures less sale of tangible fixed assets) acquired by the sector reached PHP53.4 billion in 2016.
Among industries, mobile telecommunications services had the highest share of PHP30.9 billion or 57.9 percent of the total. Wired (landline) services placed afar second with PHP7.2 billion (13.4%). Television broadcasting and relay stations and studios including closed circuit television services ranked third with PHP4.0 billion (7.4%) gross additions to tangible fixed assets.
Wired internet access service activities industry records the highest change in inventories
Change in inventories is defined as the value of ending less beginning inventory.
Among the industries, wired internet access service activities (e.g. dsl, leased line, dial-up) recorded the highest change in inventories of PHP257.6 million. Other wired telecommunications activities, and publishing of newspapers, journals and periodicals recorded a change in inventories of PHP19.3 million and PHP18.0 million, respectively.
Total subsidies reaches PHP37.7 million
In 2016, total subsidies received by the sector amounted to PHP37.7 million.
Among industries, only two were provided with subsidies by the government. These were wired (landline) services and other information technology and computer service activities with PHP25.8 million (68.4%) and PHP11.9 million (31.6%), respectively.
Sales from e-commerce transactions amounts to PHP540.1 million
E-commerce refers to the selling of products or services over electronic system. Total sales from e-commerce transactions amounted to PHP540.1 million in 2016.
Among industries, computer programming activities had the highest share amounting to PHP357.1 million or 66.1 percent of the total sales from e-commerce.
TECHNICAL NOTES
Introduction
This Special Release presents the final results of the 2016 Annual Survey of Philippine Business and Industry (ASPBI) for all Information and Communication establishments (sector J).
The ASPBI is one of the designated statistical activities of the Philippine Statistics Authority (PSA). Data collected from the survey provide information on the levels, structure, performance, and trends of economic activities of the formal sector in the entire country for the year 2016.
The survey was conducted nationwide in 2017 with 2016 as the reference period, except for employment data which is 15 November 2016.
Establishment Data Management System (EDMS) was utilized in the decentralized processing of survey questionnaires in the provinces as well as the online accomplishment of questionnaire through the PSA website.
Data are presented by industry-class or 5-digit 2009 Philippine Standard Industrial Classification (PSIC) at the national level.
Legal Authority
The conduct of the 2016 ASPBI is authorized under Republic Act 10625 known as the Philippine Statistical Act of 2013, which mandates reorganizing and strengthening of the Philippine Statistical System (PSS), its agencies and instrumentalities.
Scope and Coverage
The 2016 ASPBI covered establishments engaged in 18 economic sectors classified under the 2009 PSIC, namely:
- Agriculture, Forestry and Fishing (A)
- Mining and Quarrying (B)
- Manufacturing (C)
- Electricity, Gas, Steam, and Air Conditioning Supply (D)
- Water Supply; Sewerage, Waste Management and Remediation Activities (E)
- Construction (F)
- Wholesale and Retail Trade; Repair of Motor Vehicles and Motorcycles (G)
- Transportation and Storage (H)
- Accommodation and Food Service Activities (I)
- Information and Communication (J)
- Financial and Insurance Activities (K)
- Real Estate Activities (L)
- Professional, Scientific and Technical Activities (M)
- Administrative and Support Service Activities (N)
- Education (P)
- Human Health and Social Work Activities (Q)
- Arts, Entertainment and Recreation (R)
- Other Service Activities (S)
The survey was confined to the formal sector of the economy, which consists of the following:
- Corporations and partnership
- Cooperatives and foundations
- Single proprietorship with employment of 10 and over
- Single proprietorship with branches
Hence, the 2016 ASPBI covered only the following economic units:
- All establishments with total employment (TE) of 10 or more, and;
- All establishments with TE of less than 10, except those establishments with Legal Organization = 1 (single proprietorship) and Economic Organization = 1 (single establishment), that are engaged in economic activities classified according to the 2009 Philippine Standard Industrial Classification (PSIC).
Frame of Establishments
The frame for the 2016 ASPBI was extracted from the 2016 List of Establishments (LE). The estimated number of establishments in operation in the country in 2016 totaled to 902,213. About 294,494 establishments (32.6%) of the total establishments belong to the formal sector of which 255,403 (86.7%) comprised the frame of the survey. This frame was used to draw the sample establishments for the survey.
Unit of Enumeration
The unit of enumeration for the 2016 ASPBI is the establishment. An establishment is defined as an economic unit under a single ownership or control which engages in one or predominantly one kind of activity at a single fixed location.
Taxonomy of Establishments
An establishment is categorized by its economic organization, legal organization, industrial classification, employment size and geographic location.
Economic Organization refers to the organizational structure or role of the establishment in the organization. An establishment may be single establishment, branch, establishment and main office with branches elsewhere, main office only, and ancillary unit other than main office.
Legal Organization refers to the legal form of the economic entity which owns the establishment. An establishment may be single proprietorship, partnership, government corporation, stock corporation, non-stock corporation, and cooperative.
Industrial Classification of an economic unit was determined by the activity from which it derives its major income or revenue. The 2009 PSIC which was approved for adoption by government agencies and instrumentalities through PSA Resolution No. 1 Series 2017-158 signed on 14 February 2017 was utilized to classify economic units according to their economic activities.
Size of an establishment is determined by its TE as of specific date. TE refers to the total number of persons who work in or for the establishment.
This includes paid employees, working owners, unpaid workers and all employees who work full-time or part-time including seasonal workers. Included also are persons on short term leave such as those on sick, vacation or annual leaves and on strike.
Geographic Classification refers to the grouping of establishments by geographic area using the Philippine Standard Geographic Code (PSGC) classification. The PSGC contains the latest updates on the official number of regions, provinces, cities, municipalities, and barangays in the Philippines. The PSGC as of 31 December 2016 was used for the 2016 ASPBI.
Sampling Design
The 2016 ASPBI uses a stratified systematic sampling with 5-digit PSIC serving as industry strata and employment size as the second stratification variable. The selection of sample establishments is done independently by stratum using systematic sampling.
Estimation Procedure for Establishments with TE of Less Than 20.
a. Non-Certainty Stratum
The estimate of the total of a characteristic  for the non-certainty employment stratum TE less than 20 in the sth industry domain is
where:
s = denotes the non-certainty employment strata in TE of less than 20
Xsj = value of the jth establishment in non-certainty employment stratum in TE of less than 20 in sth industry domain
j = 1,2,3,..., ns establishments
Wsj = weight of the jth establishment in the non-certainty employment stratum in TE of less than 20 in sth industry domain

Ns = total number of establishments in the non-certainty employment stratum in TE of less than 20 in sth industry domain
ns = number of sample establishments in the non-certainty employment stratum in TE of less than 20 in sth domain
b. Certainty Stratum

where:
c = denotes the certainty employment strata in TE of less than 20 in the cth industry
Xcj = value of the jth establishment in the certainty employment strata in TE of less than 20 in the cth industry domain
j = 1,2,3,..., mc establishments
mc = number of establishments in the certainty employment strata in TE of less than 20 in the cth industry domain
c. Total Estimate for TE of Less Than 20
For all sections, except B and C, national level estimates of the total of a characteristic  for the industry domain is obtained by aggregating the estimates for all employment strata (non-certainty and certainty) in the same industry domain. That is,
where d denotes the industry domain.
Estimation Procedure for Establishments with TE of 20 and Over
a. Non-Certainty Stratum (strata of TE 20 to 49 and TE 50 to 99)
Sections A, C, E, F, G, H, I, J, K, L, M, N, P, Q, R and S.
The estimate of the total of a characteristic  for the non-certainty employment strata in an industry domain in each region,
where:
s = denotes the non-certainty employment strata in TE of 20 and over
p = 1, 2,..., 18 regions (geographic domains)
Xspj = value of the jthestablishment in the non-certainty employment strata in TE of 20 and over for an industry domain in each region
j = 1,2,3,..., nsp establishments
Wspj = weight of the jth establishment in the non-certainty employment strata in TE of 20 and over for an industry domain in each region
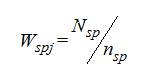
Nsp = total number of establishments in the non-certainty employment strata in TE of 20 and over for an industry domain in each region
nsp = number of sample establishments in the non-certainty employment strata in TE of 20 and over for an for an industry domain in each region
b. Certainty Stratum (Establishments under the following: Section B and D, ICT core industries except J61902, Business Process Management (BPM) industries, Government Owned and Controlled Corporations (GOCCs) and with TE 100 and over)
 for the certainty employment stratum in an industry domain in each region,
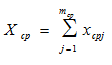
where:
c = denotes the certainty employment strata in TE of 20 and over
p = 1,2,...18 regions (geographic domains)
Xcpj = value of the jth establishment in the certainty employment strata in TE of 20 and over for an industry domain within each region
j = 1,2,3,..., mcp establishments
mcp = number of establishments in the certainty employment strata in TE of 20 and over in an industry domain within each region
c. Total Estimate for TE of 20 and Over
The estimate of the total of a characteristic  for the industry domain in each region (geopraphic domain) is obtained by aggregating the estimates for all employment strata (non-certainty and certainty) in the same industry domain,
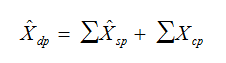
where d denotes the industry domains and p refers to region.
National level estimates of the characteristic by industry domain are obtained by aggregating separately the estimates  for the particular industry domain from all the regions.
Weight Adjusment Factor for Non-Response
To account for non-response in the non-certainty strata, the adjusment factor (n/n') was multipled with the sampling weight (W) of each of the sampling unit. The sampling weight, defined as N/n, was recomputed as
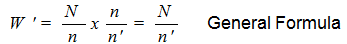
Thus, the adjusted weight (W'spj) for the non-certainty employment stratum for the industry domain with TE 20-99 was
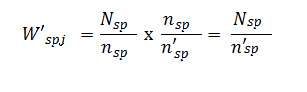
where:
Nsp = total number of establishments in the non-certainty employment stratum with TE 20-99 for the industry domain within each geographic domain (region)
n'sp = number of responding establishments in the non-certainty employment stratum with TE of 20-99 for the industry domain within each geographic domain (region)
Response Rate
Response rate for all sample establishments under Information and Communication sector was 95.0 percent (2,194 out of 2,310 establishments). This included receipts of "good" questionnaires, partially accomplished questionnaires, reports of closed, moved out or out of scope establishments.
Of the total responses, 61 establishments responded online.
Reports of the remaining non-reporting establishments were taken from other available data sources and financial statements from Securities and Exchange Commission (SEC) and other available data sources. However, report of establishments which were found to be duplicate of another establishment, and out-of-scope were not included in the generation of statistical tables.
Limitation of Data
The survey covers only the formal sector of the economy.
Concepts and Definitions of Terms
Establishment is an economic unit under a single ownership and control, i. e. under a single entity, engaged in one or predominantly one kind of economic activity at a single fixed location.
Economic activity is the establishment’s source of income. If the establishment is engaged in several activities, its main economic activity is that which earns the biggest income or revenue.
Total employment is the number of persons who worked in for the establishment as of 15 November 2016.
Paid employees are all persons working in the establishment and receiving pay, as well as those working away from the establishment paid by and under the control of the establishment. Included are all employees on sick leave, paid vacation or holiday. Excluded are consultants, home workers, receiving pure commissions only, and workers on indefinite leave.
Compensation is the sum of salaries and wages, separation/retirement/terminal pay, gratuities, and payments made by the employer in behalf of the employees such as contribution to SSS/GSIS, ECC, PhilHealth, Pag-ibig, etc.
Salaries and wages are payments in cash or in kind to all employees, prior to deductions for employee’s contributions to SSS/GSIS, withholding tax, etc. Included are total basic pay, overtime pay and other benefits.
Income or Revenue is cash received and receivables for goods/products and by-products sold and services rendered. Valuation is at producer prices (ex-establishment) net of discounts and allowances, including duties and taxes but excluding subsidies.
E-commerce is the selling of products or services over electronic systems such as Internet Protocol-based networks and other computer networks. Electronic Data Interchange (EDI) network, or other on-line system. Excluded are orders received from telephone, facsimile and e-mails.
Expense is cost incurred by the establishment during the year whether paid or payable. This is treated on a consumed basis. Valuation is at purchaser price including taxes and other charges, net of rebates, returns and allowances. Goods and services received by the establishment from other establishments of the same enterprise are valued as though purchased.
Value added is gross output less intermediate input. Gross output for Information and Communication sector is the sum of the total income (less interest income, rent income from land, dividend income, royalty income and franchise income), capital expenditures of fixed assets produced on own account and change in inventories. Intermediate input is equal to the sum of the following expense items: materials and supplies purchased; fuels, lubricants, oils and greases purchased; electricity purchased, water purchased; industrial services done by others; non-industrial services done by others (less rent expense for land); goods purchased for resale; research and development expense; environmental protection expense; royalty fee; franchise fee; and other expense.
Change in inventories is equivalent to the value of inventories at the end of the year less the value of inventories at the beginning of the year.
Inventories are stock of goods owned by and under the control of the establishment as of a fixed date, regardless of where the stocks are located. Valuation is at current replacement cost in purchaser prices. Replacement cost is the cost of an item in terms of its present price rather than its original cost.
See more at the Annual Survey of Philippine Business and Industry (ASPBI) page.
| Attachment | Size |
|---|---|
|
|
21.74 KB |
|
|
16.06 KB |