
Private general secondary education industry leads in terms of number of establishments
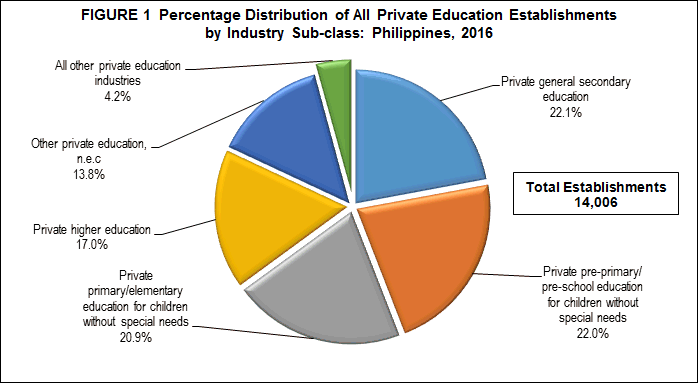
The final results of the 2016 Annual Survey of Philippine Business and Industry (ASPBI) conducted nationwide showed that there were 14,006 establishments in the formal sector of the economy that were engaged in Private Education.
Across industry sub-classes, private general secondary education registered the highest number of establishments at 3,094 (22.1%). This was followed by private pre-primary/pre-school education for children without special needs with 3,084 establishments (22.0%). Private primary/elementary education for children without special needs came third with 2,921 or 20.9 percent. Figure 1 displays the percentage distribution of all private education establishments by industry sub-class in 2016. Figure 1 displays the percentage distribution of all private education establishments by industry sub-class in 2016.
Private higher education employs bulk of the workers
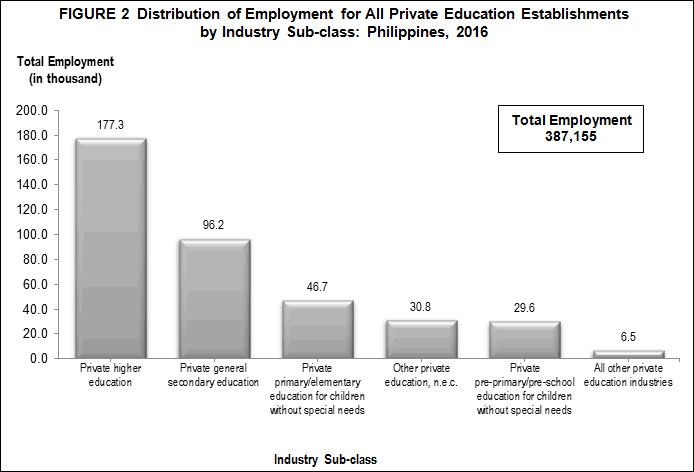
A total of 387,155 workers were hired by all private education establishments in 2016. Out of this number, 375,167 or 96.9 percent were paid employees and the remaining were working owners and unpaid workers.
About half of the total workers (45.8%) or 177,307 were employed in private higher education. This was followed by private general secondary education and private primary/elementary education for children without special needs with 96,248 (24.9%) and 46,681(12.1%) workers, respectively.
Shown in Figure 2 is the distribution of employment for all private education establishments by industry sub-class in 2016.
A national average of 28 workers per establishment was recorded for all private education establishments during the survey year. Private higher education registered the highest among industries with 74 workers per establishment. Other industries with more than 15 average workers per establishment were the following:
- Private general secondary education, 31 workers per establishment
- Private general secondary education for children with special needs, 27 workers per establishment
- Private educational support services, 17 workers per establishment
- Private primary/elementary education for children without special needs and other private education, n.e.c. each with 16 workers per establishment
Private higher education establishments pay the highest average annual compensation
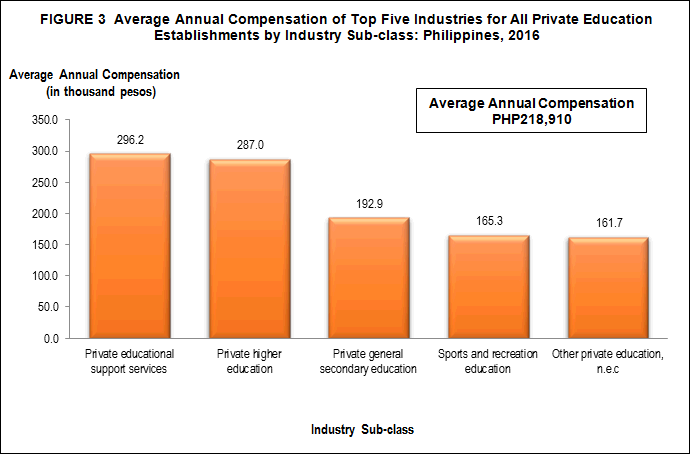
A total compensation of PHP82.1 billion was paid by all private education establishments to their employees in 2016, equivalent to an average annual pay of PHP218,910 per employee.
At the industry level, private higher education establishments paid the highest compensation of PHP50.2 billion, more than half (61.1%) of the total compensation paid for the sector. Private general secondary education ranked second in terms of compensation with PHP18.1 billion (22.0%) and private primary/elementary education for children without special needs came third with compensation of PHP5.1 billion (6.2%).
The highest paid employees were those from private educational support services with PHP296.2 thousand per employee. Private higher education establishments ranked second with annual pay of PHP287.0 thousand per employee. Employees of private technical and vocational secondary education for children with special needs on the other hand, received the lowest average annual compensation of PHP92.2 thousand per employee.
Figure 3 presents the top five industries with the highest average annual compensation for all private education establishments in 2016.
Private higher education establishments earn and spend the highest
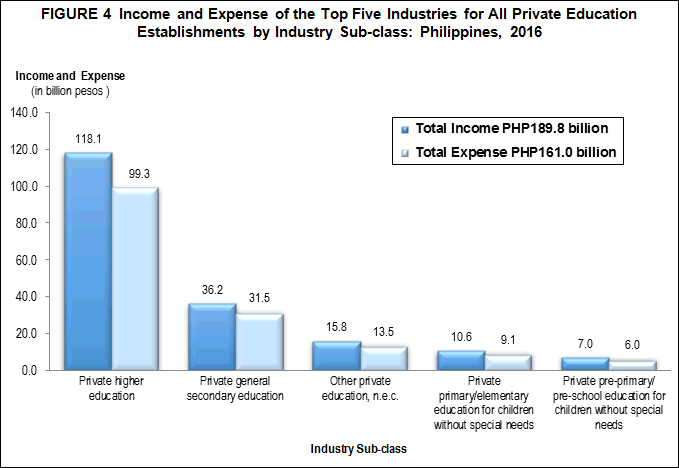
A total income of PHP189.8 billion was generated by all private education establishments in 2016. Among industries, private higher education had the highest income amounting to PHP118.1 billion (62.2%). Second and third top earners for the sector were private general secondary education and other private education, n.e.c. with corresponding income of PHP36.2 billion (19.1%) and PHP15.8 (8.3%), respectively.
On the other hand, total expense of PHP161.0 billion was incurred by all private education establishments during their operation in 2016. As the top-most income generating industry, private higher education also spent the largest amounting to PHP99.3 billion (61.6%). Private general secondary education and other private education. n.e.c. came second and third place, with expenses of PHP31.5 (19.5%) and PHP13.5 billion (8.4%), respectively. Private technical and vocational secondary education for children with special needs recorded the least expense of PHP35.3 million (0.02%).
Figure 4 displays the top five industries in terms of income and expense for all private education establishments in 2016.
Cultural education posts the highest returns
The income generated per peso expense for all private education establishments stood at 1.18. This means that the sector generated an income of PHP1.18 for every peso spent in the operation of its business.
Among industries, five posted an income per expense ratio of above the national level and these were the following:
- Cultural education, 1.43
- Private pre-primary/pre-school education for children with special needs, 1.27
- Private primary/elementary education for children with special needs, 1.26
- Sports and recreation education, 1.23
- Private higher education, 1.19
Private higher education contributes more than half to the total value added
In 2016, value added generated by all private education establishments was estimated at PHP127.8 billion.
At the industry level, private higher education accounted for more than half (63.0%) of the total value added of the sector amounting to PHP80.6 billion. Private technical and vocational secondary education for children with special needs registered the lowest value added of PHP25.0 million (0.02%).
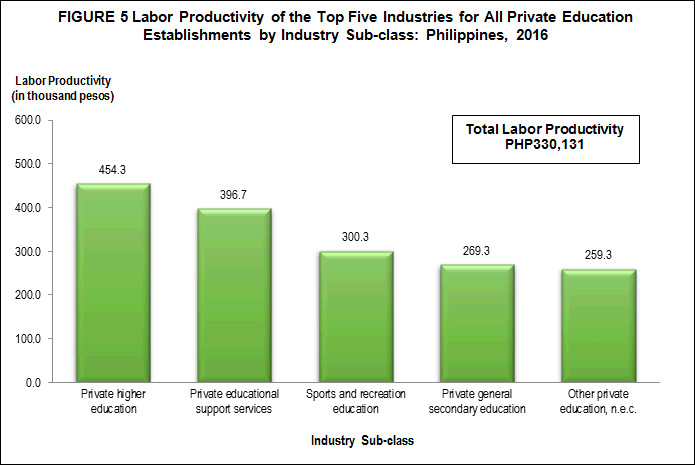
Labor productivity stands at PHP330,131 per worker
Labor productivity, defined as value added per worker, was recorded at PHP330.1 thousand per worker in 2016.
By industry, private higher education recorded the highest labor productivity of PHP454.3 thousand per worker. This was followed by private educational support services with labor productivity of PHP396.7 thousand per worker. Completing the top three industries in terms of labor productivity was sport and recreational education with labor productivity of PHP300.3 thousand per worker
Figure 5 shows the labor productivity of the top five industries for all private education establishments in 2016.
Gross additions to tangible fixed assets amounts to PHP13.1 billion in 2016
Value of gross additions to tangible fixed assets is defined as capital expenditure less sale of fixed assets. A total of PHP13.1 billion worth of tangible fixed assets was acquired by all private education establishments in 2016.
More than half (61.5%) of the total gross additions to tangible fixed assets or PHP8.0 billion was acquired by private higher education. Private general secondary education and private primary/elementary education for children without special needs followed with gross additions to tangible assets amounting to PHP3.4 billion (25.7%), and PHP977.3 million (7.5%), respectively.
Private pre-primary/pre-school education for children without special needs industry posts the highest change in inventories
Change in inventories is defined as the value of ending less the beginning inventory. All private education establishments recorded a total of PHP12.7 million change in inventories in 2016.
Among industries, two recorded more than PHP20.0 million worth of change in inventories each, and these were private pre-primary/pre-school education for children without special needs with PHP32.8 million and private higher education with PHP21.5 million.
Highest subsidy was alloted to private general secondary education
Total subsidies received by all private education establishments from the government totalled to PHP2.9 billion in 2016. Out of the 13 industries, seven had a share to the total subsidies provided by the government to the sector. Private general secondary education was allotted the highest subsidy worth PHP1.7 billion (59.4%) while private general secondary education for children with special needs was granted the least subsidy of PHP108.0 thousand.
TECHNICAL NOTES
Introduction
This Special Release presents the final results of the 2016 Annual Survey of Philippine Business and Industry (ASPBI) for all Education establishments (sector P) except public education.
The ASPBI is one of the designated statistical activities of the Philippine Statistics Authority (PSA). Data collected from the survey provide information on the levels, structure, performance, and trends of economic activities of the formal sector in the entire country for the year 2016.
The survey was conducted nationwide in 2017 with the year 2016 as the reference period, except for employment where the reference period is November 15, 2016.
Establishment Data Management System (EDMS) was utilized in the decentralized processing of 2016 ASPBI questionnaires in the provinces as well as the online accomplishment of questionnaire through the PSA website.
Data are presented by industry sub-class or 5-digit 2009 Philippine Standard Industrial Classification (PSIC) at the national.
Legal Authority
The conduct of the 2016 ASPBI is authorized under Republic Act 10625, known as the Philippine Statistical Act of 2013, which mandates reorganizing and strengthening of the Philippine Statistical System (PSS), its agencies and instrumentalities.
Scope and Coverage
The 2016 ASPBI covered establishments engaged in 18 economic sectors classified under the 2009 PSIC, namely:
- Agriculture, Forestry and Fishing (A)
- Mining and Quarrying (B)
- Manufacturing (C)
- Electricity, Gas, Steam, and Air Conditioning Supply (D)
- Water Supply; Sewerage, Waste Management and Remediation Activities (E)
- Construction (F)
- Wholesale and Retail Trade; Repair of Motor Vehicles and Motorcycles (G)
- Transportation and Storage (H)
- Accommodation and Food Service Activities (I)
- Information and Communication (J)
- Financial and Insurance Activities (K)
- Real Estate Activities (L)
- Professional, Scientific and Technical Activities (M)
- Administrative and Support Service Activities (N)
- Education (P)
- Human Health and Social Work Activities (Q)
- Arts, Entertainment and Recreation (R)
- Other Service Activities (S)
The survey was confined to the formal sector of the economy, which consists of the following:
- Corporations and partnerships
- Cooperatives and foundations
- Single proprietorship with employment of 10 and over
- Single proprietorship with branches
Hence, the 2016 ASPBI covered only the following economic units:
- All establishments with total employment (TE) of 10 or more, and;
- All establishments with TE of less than 10, except those establishments with Legal Organization = 1 (single proprietorship) and Economic Organization = 1 (single establishment), that are engaged in economic activities classified according to the 2009 Philippine Standard Industrial Classification (PSIC).
Frame of Establishments
The frame for the 2016 ASPBI was extracted from the 2016 List of Establishments (LE). The estimated number of establishments in operation in the country in 2016 totaled to 902,213. About 294,494 establishments (32.6% of the total establishments) belong to the formal sector of which 255,403 (86.7%) comprised the establishment frame. This frame was used to draw the sample establishments for the survey.
Unit of Enumeration
The unit of enumeration for the 2016 ASPBI is the establishment. An establishment is defined as an economic unit under a single ownership or control which engages in one or predominantly one kind of activity at a single fixed location.
Taxonomy of Establishments
An establishment is categorized by its economic organization, legal organization, industrial classification, employment size and geographic location.
Economic Organization refers to the organizational structure or role of the establishment in the organization. An establishment may be single establishment, branch, establishment and main office with branches elsewhere, main office only, and ancillary unit other than main office.
Legal Organization refers to the legal form of the economic entity which owns the establishment. An establishment may be single proprietorship, partnership, government corporation, stock corporation, non-stock corporation, and cooperative.
Industrial Classification of an economic unit was determined by the activity from which it derives its major income or revenue. The 2009 PSIC which was approved for adoption by government agencies and instrumentalities through PSA Resolution No. 1 Series 2017-158 signed on 14 February 2017 was utilized to classify economic units according to their economic activities.
Size of an establishment is determined by its total employment (TE) as of specific date. Total employment (TE) refers to the total number of persons who work in or for the establishment.
This includes paid employees, working owners, unpaid workers and all employees who work full-time or part-time including seasonal workers. Included also are persons on short term leave such as those on sick, vacation or annual leaves and on strike.
Geographic Classification refers to the grouping of establishments by geographic area using the Philippine Standard Geographic Code (PSGC) classification. The PSGC contains the latest updates on the official number of regions, provinces, cities, municipalities, and barangays in the Philippines. The PSGC as of 31 December 2016 was used for the 2016 ASPBI.
Methodology
Sampling Design
Selection of sample establishment for the 2016 ASPBI was done using stratified systematic sampling with 5-digit PSIC serving as industry strata and employment size as the second stratification variable.
For establishments with TE of Less Than 20.
a. Non-Certainty Stratum
The estimate of the total of a characteristic  for the non-certainty employment strata in TE of 20 and over for an industry domain in each region
where:
s = denotes the non-certainty employment strata in of less than 20
Xsj = value of the jth establishment in the non-certainty employment stratum in TE of less than 20 in Sth industry domain
j = 1,2,3,..., ns establishments
Wsj = weight of the jth establishment in the non-certainty employment stratum in TE of less than 20 in Sth industry domain

Ns = total number of establishments in the non-certainty employment stratum in TE of less than 20 in Sth industry domain
ns = number of sample establishments in the non-certainty employment stratum in TE of less than 20 in Sth industry domain
b. Certainty Stratum

where:
c = denotes the certainty employment strata in TE of less than 20 in the cth industry
Xcj = value of the jth establishment in the certainty employment strata in TE of less than 20 in the cth industry domain
j = 1,2,3,..., mc establishments
mc = number of establishments in the certainty employment strata in TE of less than 20 in the cth industry domain
c. Total Estimate for TE of Less Than 20
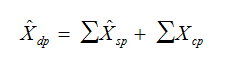
For all sections except B and C, national level estimates of the total of a characteristic  for the industry domain was obtained by aggregating the estimates for all employment strata (non-certainty and certainty) in the same industry domain,
where d denotes the industry domains in each region
For establishments with TE of 20 and over, the 18 administrative regions serve as the geographic domains while the 5-digit level of the 2009 PSIC serves as the industry domains.
Estimation Procedure for Establishments with TE of 20 and Over
a. Non-Certainty Stratum (strata of TE 20 to 49 and TE 50 to 99)
Sections A, C, E, F, G, H, I, J, K, L, M, N, P, Q, R and S.
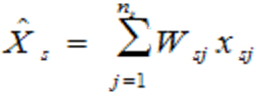
The estimate of the total of a characteristic  for the non-certainty employment strata in an industry domain in each region

where:
s = denotes the non-certainty employment strata in TE of 20 and over
p = 1, 2,..., 18 regions (geographic domains)
Xspj = value of the jthestablishment in the non-certainty employment strata with TE of 20 and over for an industry domain in each region
j = 1,2,3,..., nsp establishments
Wspj = weight of the jth establishment in the non-certainty employment strata with TE of 20 and over for an industry domain in each region

Nsp = total number of establishments in the non-certainty employment strata in TE of 20 and over for an industry domain in each region
nsp = number of sample establishments in the non-certainty employment strata in TE of 20 and over for an industry domain in each region
b. Certainty Stratum (Establishments under the following: Section B and D, ICT core industries, BPM industries, GOCC's and with TE 100 and over)
 for the certainty employment stratum in an industry domain in each region
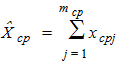
where:
c = denotes the certainty employment strata in TE of 20 and over
p = 1,2,...18 regions (geographic domains)
Xcpj = value of the jth establishment in the certainty employment strata in TE of 20 and over for an industry domain in each region
j = 1,2,3,..., mcp establishments
mcp = number of establishments in the certainty employment strata in TE of 20 and over in an industry domain within each region
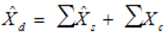
c. Total Estimate for TE of 20 and Over
The estimate of the total of a characteristic  for the industry domain in each region (geopraphic domain) was obtained by aggregating the estimated for all employment strata (non-certainty and certainty) in the same industry domain,
where dp denotes the industry domains in each region
National level estimates of the characteristics by industry domain were obtained by aggregating separately the estimates  for the particular industry domain from all the regions,
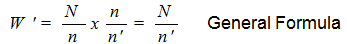
Weight Adjusment Factor for Non-Response
To account for non-response in the non-certainty strata, the adjusment factor and (n/n') was multipled with the sampling weight (W) of each of the sampling unit. The sampling weight which is defined as N/n, was recomputed as
Thus, the adjusted weight (W'spj) for the non-certainty employment stratum for the industry domain with TE 20-99 was
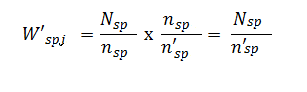
Where:
Nsp = total number of establishments in the non-certainty employment stratum with TE 20-99 for the industry domain within each geographic domain (region)
n'sp = number of responding establishments in the non-certainty employment stratum with TE of 20-99 for the industry domain within each geographic domain (region)
Response Rate
Response rate for all Private Education establishments was 93.1 percent (1,234 out of 1,325 establishments). This included receipts of "good" questionnaires, partially accomplished questionnaires, reports of closed, moved out or out of scope establishments.
Of the total responses, 49 establishments responded online.
Reports of the remaining non-reporting establishments were taken from other available administrative data sources and financial statements from Securities and Exchange Commission (SEC). However, there were establishments which were found to be duplicates, out-of-scope and out of business in 2016.
Limitation of Data
Only the formal sector was covered in the survey. Only private education establishments were included in this survey.
Concepts and Definitions of Terms
Establishment is an economic unit under a single ownership and control, i. e. under a single entity, engaged in one or predominantly one kind of economic activity at a single fixed location.
Economic activity is the establishment’s source of income. If the establishment is engaged in several activities, its main economic activity is that which earns the biggest income or revenue.
Total employment is the number of persons who worked in or for the establishment as of 15 November 2016.
Paid employees are all persons working in the establishment and receiving pay, as well as those working away from the establishment paid by and under the control of the establishment. Included are all employees on sick leave, paid vacation or holiday. Excluded are consultants, home workers, receiving pure commissions only, and workers on indefinite leave.
Compensation is the sum of salaries and wages, separation/retirement/terminal pay, gratuities, and payments made by the employer in behalf of the employees such as contribution to SSS/GSIS, ECC, PhilHealth, Pag-ibig, etc.
Salaries and wages are payments in cash or in kind to all employees, prior to deductions for employee’s contributions to SSS/GSIS, withholding tax, etc. Included are total basic pay, overtime pay and other benefits.
Income or Revenue refers to cash received and receivables for goods/products and by-products sold and services rendered. Valuation is at producer prices (ex-establishment) net of discounts and allowances, including duties and taxes but excluding subsidies.
E-commerce refers to the selling of products or services over electronic systems such as Internet Protocol-based networks and other computer networks, Electronic Data Interchange (EDI) network, or other on-line system. Excluded are orders received from telephone, facsimile and e-mails.
Expense refers to cost incurred by the establishment during the year whether paid or payable. This is treated on a consumed basis. Valuation is at purchaser price including taxes and other charges, net of rebates, returns and allowances. Goods and services received by the establishment from other establishments of the same enterprise are valued as though purchased.
Value added is gross output less intermediate input. Gross output for Education sector is the sum of the total income (less interest income, rent income from land, dividend income, royalty income and franchise income), capital expenditures of fixed assets produced on own account and change in inventories. Intermediate input is equal to the sum of the following expense items: materials and supplies purchased; fuels, lubricants, oils and greases purchased; electricity purchased, water purchased; industrial services done by others; non-industrial services done by others (less rent expense for land); goods purchased for resale; research and development expense; environmental protection expense; royalty fee; franchise fee; and other expense.
Change in inventories is equivalent to the value of inventories at the end of the year less the value of inventories at the beginning of the year.
Inventories are stock of goods owned by and under the control of the establishment as of a fixed date, regardless of where the stocks are located. Valuation is at current replacement cost in purchaser prices. Replacement cost is the cost of an item in terms of its present price rather than its original cost.
See more at the Annual Survey of Philippine Business and Industry (ASPBI) page.
| Attachment | Size |
|---|---|
|
|
20.88 KB |
|
|
12.04 KB |