
Total number of all manufacturing establishments reaches 24,496
The total number of all manufacturing establishments in the formal sector of the economy reached 24,496 according to the final results of the 2015 Annual Survey of Philippine Business and Industry (ASPBI).
Industry-wise, the top ten manufacturing industries comprised more than half (58.4%) of all manufacturing establishments in the country. Baking of bread, cakes, pastries, pies and similar 'perishable' bakery products led the industries with 6,704 establishments or 27.4 percent of the total. Manufacture of bottled water followed with 2,350 establishments (9.6%). Printing ranked third with 1,439 establishments (5.9%).
Other industries in the top ten are the following:
- Rice/corn milling (1,154 establishments or 4.7%)
- Manufacture of wood furniture (710 establishments or 2.9%)
- Manufacture of structural concrete products (457 establishments or 1.9%)
- Women's and girls' and babies' garment manufacturing (395 establishments or 1.6%)
- Custom tailoring (393 establishments or 1.6%)
- Manufacture of plastic articles for packing goods (383 establishments or 1.6%)
- Men's and boys' garment manufacturing (330 establishments or 1.3%)
Figure 1 presents the percent distribution of all manufacturing establishments by industry sub-class in 2015.

Semiconductor devices and other electronic components industry employs the most number of workers
Total employment generated by all manufacturing establishments reached 1,293,811 in 2015. Of this, 98.4percent were paid employees while the rest were working owners and unpaid workers.
The top ten industries in terms of employment generation accounted for more than one third (40.9%) or a total of 529,242 workers. Manufacture of semi-conductor devices and other electronic components employed the most number with 150,821 workers or 11.6 percent of the total. Baking of bread, cakes, pastries, pies and similar ‘perishable' bakery products, including hopia and doughnut making, came in second with 87,477 workers (6.8%). Manufacture of computers and peripheral equipment and accessories followed with 73,462 workers (5.7%).
Other industries comprising the top ten in terms of employment generation were:
- Manufacture of electric ignition or starting equipment for internal combustion engines (42,621 workers)
- Women's and girls' and babies' garment manufacturing (42,454 workers)
- Manufacture of parts and accessories for motor vehicles and their engines (31,569 workers)
- Printing (26,442 workers)
- Manufacture of plastic articles for packing goods (25,430 workers)
- Manufacture ofwearing apparel, n.e.c. (25,153 workers)
- Men's and boys' garment manufacturing (23,813 workers)
Figure 2 shows the percent distribution of employment of all manufacturing establishments by industry sub-class in 2015.

Total compensation paid by manufacturing establishments reaches PHP335.1 billion
Total compensation paid to employees by all manufacturing establishments reached PHP335.1 billion in 2015 which was equivalent to an average annual compensation of PHP263,265 per employee. Average annual compensation paid by 103 industry sub-classes or group of sub-classes surpassed the national average.
Among the industry sub-classes, manufacture of refined petroleum products paid the highest average annual compensationof PHP1.9 million per employee. The combined manufacturing industries of powdered milk and condensed or evaporated milk followed closely with PHP1.8 million per employee.Refer to Table 1 for the list of industries that paid an average annual compensation per employee of more than PHP1.0 million in 2015.
TABLE 1 Average Annual Compensation of Employees in Top-Paying Manufacturing Establishments by Industry Sub-Class: Philippines, 2015
|
2009 PSIC Code |
Industry Description |
Average Annual Compensation per Employee
(PHP1,000) |
|---|---|---|
|
C19200 |
Manufacture of refined petroleum products |
1,982 |
|
C10520
and
C10530
|
Manufacture of powdered milk (except for infants) and condensed or evaporated milk (filled, combined or reconstituted); and,
Manufacture of infants' powdered milk
|
1,852 |
|
C10798 |
Manufacture of vinegar |
1,383 |
|
C20232 |
Manufacture of cleaning preparations, except soap and detergents |
1,196 |
|
C10797 |
Manufacture of mayonnaise, salad dressing, sandwich spread and similar products |
1,184 |
|
C28193 |
Manufacture of unit air-conditioners |
1,166 |
|
C23940 |
Manufacture of cement |
1,110 |
|
C30300 |
Manufacture of air and spacecraft and related machinery |
1,027 |
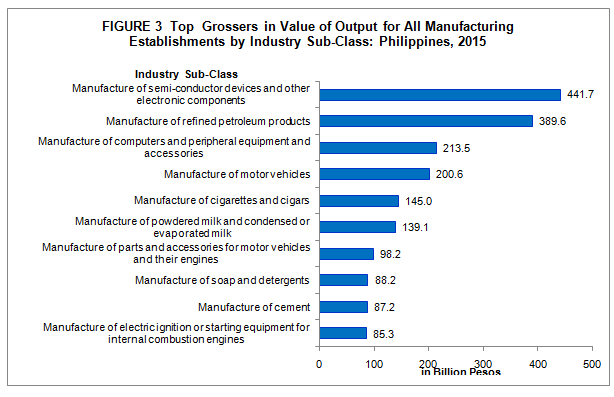
Semi-conductor devices and other electronic components industry leads the manufacturing industries in terms of value of output
In 2015, value of output generated by all manufacturing establishments was estimated atPHP4.6 trillion.
The combined output value of the top ten industries or group of industries accounted for PHP1.9 trillion or a combined share of 41.3 percent of the total. Of all manufacturing establishments, manufacture of semi-conductor devices and other electronic components was the highest with output value of PHP441.7 billion or 9.7 percent. Manufacture of refined petroleum products ranked second with PHP389.6 billion or 8.5 percent.
Completing the list of the top ten contributors to PHP1.9 trillion worth of value of output were the following:
- Manufacture of computers and peripheral equipment and accessories (PHP213.5 billion)
- Manufacture of motor vehicles (PHP200.6 billion)
- Manufacture of cigarettes and cigars (PHP145.0 billion)
- Manufacture of powdered milk and condensed or evaporated milk (PHP139.1 billion)
- Manufacture of parts and accessories for motor vehicles and their engines (PHP98.2 billion)
- Manufacture of soap and detergents (PHP88.2 billion)
- Manufacture of cement (PHP87.2 billion)
- Manufacture of electric ignition or starting equipment for internal combustion engines (PHP85.3 billion)
Figure 3 shows the top ten industries that generated the highest value of output for all manufacturing establishments in 2015.
Intermediate expense remains at PHP3.0 trillion
Intermediate expense incurred by all manufacturing establishments stood at PHP3.0 trillion in 2015.
Manufacture of refined petroleum products spent the highest which amounted to PHP332.2 billion or 10.9 percent of the total. Manufacture of semi-conductor devices and other electronic components followed with PHP287.8 billion (9.4%) while manufacture of computers and peripheral equipment and accessories placed third with PHP162.8 billion (5.3%).
Semi-conductor devices and other electronic components industry generates the highest value added
Value added generated by all manufacturing establishments remained at PHP1.2 trillion in 2015.
The combined value added of the top ten industries reached PHP596.3 billion (50.7%). Manufacture of semi-conductor devices and other electronic components led the top contributors to value added with PHP133.8 billion or 11.4 percent. Manufacture of cigarettes and cigars came in second with PHP108.7 billion or 9.2 percent. Manufacture of motor vehicles ranked third with PHP104.6 billion or 8.9 percent.
The ratio of value added to total employment, a measure of labor productivity, was recorded at PHP909 thousand per worker. Manufacture of malt liquors and malt exhibited the highest labor productivity of PHP15,374 thousand per worker.
Table 2 presents the manufacturing industries with more than PHP4.0 million of reported labor productivity in 2015.
|
Rank |
2009 PSIC Code |
Industry Description |
Value Added per Total Employment (PHP1,000) |
|---|---|---|---|
|
1 |
C11030 |
Manufacture of malt liquors and malt |
15,374 |
|
2 |
C29100 |
Manufacture of motor vehicles |
15,291 |
|
3 |
C11010 |
Distilling, rectifying and blending of spirits |
14,430 |
|
4 |
C12010
and
C12020
|
Manufacture of cigarettes;
and,
Manufacture of cigars
|
14,166 |
|
5 |
C19200 |
Manufacture of refined petroleum products |
11,422 |
|
6 |
C11060 |
Manufacture of sports and energy drink |
8,866 |
|
7 |
C10520
and
C10530
|
Manufacture of powdered milk (except for infants) and condensed or evaporated milk (filled, combined or reconstituted); and,
Manufacture of infants' powdered milk
|
8,442 |
|
8 |
C23940 |
Manufacture of cement |
6,938 |
|
9 |
C10797 |
Manufacture of mayonnaise, salad dressing, sandwich spread and similar products |
6,747 |
|
10 |
C10540 |
Manufacture of butter, cheese and curd |
5,778 |
|
11 |
C10622 |
Flour milling except cassava flour milling |
4,890 |
|
12 |
C20232 |
Manufacture of cleaning preparations, except soap and detergents |
4,385 |
|
13 |
C20231 |
Manufacture of soap and detergents |
4,210 |
Semi-conductor devices and other electronic components industry contributes the highest gross addition to tangible fixed assets
In 2015, gross addition to tangible fixed assets of all manufacturing establishments reached PHP114.9 billion.
The top 12 industries, each contributed more than PHP2.0 billion of gross additionsto tangible fixed assets, accounted for PHP67.1 billion or 58.4 percent.
Manufacture of semi-conductor devices and other electronic components registeredthe highest gross addition to tangible fixed assets at PHP17.6 billion or 15.4 percent. Manufacture of refined petroleum products ranked second with PHP15.2 billion or 13.3 percent.Non-ferrous smelting and refining, except precious metals, followed with PHP8.3 billion or 7.2 percent.
Fluid power equipment industry receives PHP 554.8 million worth of subsidies
Subsidies received by all manufacturing establishments amounted to PHP2.2 billion in 2015.
Among the industries, the top three received subsidies of PHP1.2 billion or a combined share of 54.4 percent. Manufacture of fluid power equipment industries received the highest subsidies accounting for PHP554.8 million or 25.3 percent of the total. Building of ships and boats other than sports and pleasure boats followed with PHP357.0 million (16.3%). Manufacture of parts and accessories for motor vehicles and their engines came in third with PHP282.9 million (12.9%).
Inorganic salts and compounds industry accounts for 84.6 percent ofe-commerce sales
E-commerce sales generated by all manufacturing establishments reached PHP132.9 million in 2015.
Manufacture of inorganic salts and compounds recorded the highest sales through e-commerce at PHP112.5 million or 84.6 percent. Manufacture of miscellaneous fabricated metal products, n.e.c. followed with PHP8.4 million (6.3%) while manufacture of wearing apparel, n.e.c. marketed PHP8.3 million (6.3%).
TECHNICAL NOTES
Introduction
This Special Release presents the final results of the 2015 ASPBI for all manufacturing establishments.
The 2015 ASPBI is one of the designated statistical activities of the Philippine Statistics Authority (PSA). Data collected from the survey provides information on the levels, structure, performance and trends of economic activities of the formal sector in the entire country. The 2015 Survey on Information and Communication Technology (SICT) was undertaken as a rider to this survey.
The data processing for this survey was decentralized to the Provincial Statistical Services Offices (PSSOs) as the provinces are near the establishments which are the data sources of the survey.
The survey was conducted nationwide in April 2016 with the year 2015 as the reference period, except for employment which is as of November 15, 2015.
Data are presented at the national level and by industry sub-class or 5-digit 2009 Philippine Standard Industrial Classification (PSIC).
Legal Authority
The conduct of 2015 ASPBI is authorized under the following:
Republic Act 10625 known as the Philippine Statistical Act of 2013 dated September 12, 2013 - (Reorganizing and Strengthening of the Philippine Statistical System (PSS), its agencies and instrumentalities). It shall be the policy of the State to effect the necessary and proper changes in the organizational and functional structures of the PSS in order to rationalize and promote efficiency and effectiveness in the delivery of statistical services.
Scope and Coverage
The 2015 ASPBI covered establishments engaged in 18 economic sectors classified under the 2009 PSIC, namely:
- Agriculture, Forestry and Fishing (A)
- Mining and Quarrying (B)
- Manufacturing (C)
- Electricity, Gas, Steam, and Air Conditioning Supply (D)
- Water Supply; Sewerage, Waste Management and Remediation Activities (E)
- Construction (F)
- Wholesale and Retail Trade; Repair of Motor Vehicles and Motorcycles (G)
- Transportation and Storage (H)
- Accommodation and Food Service Activities (I)
- Information and Communication (J)
- Financial and Insurance Activities (K)
- Real Estate Activities (L)
- Professional, Scientific and Technical Activities (M)
- Administrative and Support Service Activities (N)
- Education (P)
- Human Health and Social Work Activities (Q)
- Arts, Entertainment and Recreation (R)
- Other Service Activities (S)
The survey was confined to the formal sector of the economy, which consists of the following:
- Corporations and partnership
- Cooperatives and foundations
- Single proprietorship with employment of 10 and over
- Single proprietorships with branches
Hence, the 2015 ASPBI covered only the following economic units:
- All establishments with total employment (TE) of 10 and over, and
- All establishments with TE of less than 10, except those establishments with Legal Organization = 1 (single proprietorship) and Economic Organization = 1 (single establishment), that are engaged in economic activities classified according to the 2009 PSIC.
Frame
The frame for the 2015 ASPBI was extracted from the 2015 List of Establishments (LE).
The estimated number of establishments in the 2015 LE totaled 909,786 establishments in operation in the country in 2015. Of this, about 29.0 percent or 259,386 establishments belong to the formal sector of which 86.0 percent or 223,821 establishments comprised the establishment frame. This frame was used to draw the sample establishments for the survey.
Unit of Enumeration
Like all other establishments censuses/surveys conducted by the PSA, the 2015 ASPBI unit of enumeration is the establishment. The establishment is defined as an economic unit under a single ownership or control which engages in one or predominantly one kind of activity at a single fixed location.
For manufacturing, the unit of enumeration consists of shop, factory, bakery, mill, distillery, refinery, cannery, abattoir, brewery, foundry, printing press, tannery or plant engaged in manufacturing, processing, fabricating or finishing products mechanically or manually including the assembly of component parts of manufactured products and the substantial alteration, reconstruction or repair of special type of goods and classified under economic organization such as: single establishment (EO=1), branch only (EO=2) and establishment and main office (EO=3).
Classification of Establishments
An establishment is categorized by its economic organization, legal organization, industrial classification, employment size, and geographic location.
Economic Organization relates to the organizational structure or role of the establishment in the organization. An establishment may be single establishment, branch, establishment and main office with branches elsewhere, main office only, and ancillary unit other than main office.
Legal Organization refers to the legal form of the economic entity that owns the establishment. This provides the legal basis for ownership. An establishment may be single proprietorship; partnership; government corporation; stock corporation; non-stock, non-profit corporation; and cooperative.
Industrial classification of an economic unit was determined by the activity from which it derives its major income or revenue. The 2009 PSIC was utilized to classify economic units according to their economic activities.
Size of an establishment is determined by its total employment (TE) as of a specific date.
Geographic Classification refers to classification of establishments by geographic area using the Philippine Standard Geographic Code (PSGC) classification.
Methodology
Sampling Design
The 2015 ASPBI utilized stratified systematic sampling with 5-digit PSIC serving as the industry strata and employment size as the second stratification variable.
For establishments with TE of 20 and over, the 17 administrative regions serve as the geographic domains.
The industry domains (industry strata) for the survey were the 5-digit level (industry sub-class) of the 2009 PSIC. For the manufacturing sector, 424 industry sub-classes serve as the industry domain.
Estimation Procedure
For Establishments with TE of Less Than 20
- Non-certainty Stratum
The estimate of the total of a characteristic for the non-certainty employment stratum TE less than 20 in the sth industry domain is

where:
|
s |
denotes the non-certainty employment strata in employment of less than 20
|
|
xsj
|
value of the jth establishment in the non-certainty employment stratum in employment of less than 20 in the sth industry domain
|
|
j
|
1, 2, 3, …, ns establishments
|
|
Wsj
|
weight of the jth establishment in the non-certainty employment stratum in employment of less than 20 in the sth industry domain
|

where:
|
Ns
|
total number of establishments in the non-certainty employment stratum in employment of less than 20 in the sth industry domain
|
|
ns
|
number of sample establishments in the non-certainty employment stratum in employment less than 20 in the sth industry domain
|
- Certainty Stratum
The estimate of the total of a characteristic for the certainty employment stratum in the cth industry domain is

where:
|
c
|
denotes the certainty employment strata in employment of less than 20 in the cth industry domain
|
|
xcj
|
value of the jth establishment in the certainty employment strata in employment of less than 20 in the cth industry domain
|
|
j
|
1, 2, 3, …, mc establishments
|
|
mc
|
number of establishments in the certainty employment strata in employment of less than 20 in the cth industry domain
|
Total Estimate for TE of Less Than 20
National level estimates of the total of a characteristic for the industry domain was obtained by aggregating the estimates for all employment strata (non-certainty and certainty) in the same industry domain,

where: d denotes the industry domain
For Establishments with TE of 20 and Over
- Non-Certainty Stratum (TE of 20-49 and 50-99)
The estimate of the total of a characteristic for the non-certainty employment stratum in TE of 20 and over for an industry domain in each region (geographic domain) is
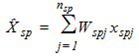
where:
|
s
|
denotes the non-certainty employment stratum in TE of 20 and over
|
|
p
|
1, 2,..., 17 regions (geographic domains)
|
|
xsp j
|
value of the jth establishment in the non-certainty employment stratum in TE of 20 and over for an industry domain in each region
|
|
j
|
1, 2, 3,…, nsp establishments
|
|
Wspj
|
weight of the jth establishment in the non-certainty employment stratum in TE of 20 and over for an industry domain in each region
|
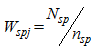
where:
|
Nsp
|
total number of establishments in the non-certainty employment stratum in TE of 20 and over for an industry domain in each region
|
|
nsp
|
number of sample establishments in the non-certainty employment stratum in TE of 20 and over for an industry domain in each region
|
- Certainty Stratum
The estimate of the total of a characteristic for the certainty employment stratum in TE of 20 and over in an industry domain in each geographic domain (region) is
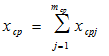
where:
|
c
|
denotes the certainty employment stratum in TE of 20 and over
|
|
p
|
1, 2,..., 17 regions (geographic domains)
|
|
xcpj
|
value of the jth establishment in the certainty employment stratum in TE of 20 and over in an industry domain within each region
|
|
j
|
1, 2, 3, …, mcp establishments
|
|
mcp
|
number of establishments in the certainty employment stratum in TE of 20 and over in an industry domain within each region
|
Total Estimate for TE of 20 and over
The estimate of the total of a characteristic  for the industry domain in each region (geographic domain) was obtained by aggregating the estimates for all employment strata (non-certainty and certainty) in the same industry domain,

where: dp denotes the industry domains in each region
National level estimates of the characteristics by industry domain were obtained by aggregating separately the estimates (  ) for the particular industry domain from all the regions.
Total Estimate for all establishment
National level estimates of the characteristics by industry domain were obtained by aggregating separately the total estimates of TE of less than 20 and TE of 20 and over for a particular industry domain.
Weight Adjustment Factor for Non-Response
To account for non-response in the non-certainty strata, the adjustment factors, and (n/n’) was multiplied with the sampling weight (W) of each of the sampling unit. The sampling weight which is defined as N/n was recomputed as
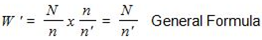
Thus, the adjusted weight (W’sj) for employment stratum in TE of 1-9 and 10-19 is
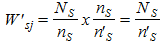
where:
|
Ns
|
total number of establishments in the employment stratum in TE of 1-9 and 10-19 in the sth industry domain
|
|
n’s
|
number of responding establishments in the employment stratum in TE of 1-9 and 10-19 in the sth industry domain
|
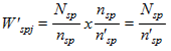
For the non-certainty employment stratum in TE of 20-49 and 50-99, the adjusted weight (W'spj ) is
where:
|
Nsp
|
total number of establishments in the non-certainty employment stratum in TE of 20-49 and 50-99 for an industry domain within each geographic domain (region)
|
|
n’sp
|
number of responding establishments in the non-certainty employment stratum in TE of 20-49 and 50-99 for an industry domain within each geographic domain (region)
|
Response Rate
The response rate for all manufacturing establishments was 95.0 percent (6,308 out of 6,628 establishments). Included are receipts of "good" questionnaires, partially accomplished questionnaires, reports of closed, moved out or out of scope establishments, etc.
Reports of the remaining non-reporting establishments were imputed based on established imputation methods and from other available administrative data sources. However, there were establishments which were found to be duplicates and out of business in 2015.
Concepts and Definitions of Terms
Establishment is an economic unit under a single ownership control, i.e., under a single entity, engaged in one or predominantly one kind of economic activity at a single fixed location.
Total employment is the number of persons who worked in for the establishment as of November 15, 2015.
Paid employees are all full-time and part-time employees working in or for the establishment and receiving pay, as well as those working away from the establishment and paid by and under the control of the establishment. Included also are all employees on sick or maternity leave, paid vacation or holiday and on strike. Excluded are directors paid solely for their attendance at meetings, consultants, workers on indefinite leave, working owners who do not receive regular pay, homeworkers, workers receiving pure commissions only and workers not in the payroll of this establishment.
Unpaid workers are working owners who do not receive regular pay, apprentices and learners without regular pay, and persons working for at least 1/3 of the working time normal to the establishment without regular pay. Excluded are silent or inactive business partners.
Compensation is the sum of salaries and wages, separation, terminal pay and gratuities paid by the employer to its employees and total employer’s contribution to SSS/GSIS, ECC, PhilHealth, PAG-IBIG etc.
Income or Revenue refers to cash received and receivables for goods sold and services rendered.
Expense refers to the cost incurred in an enterprise’s efforts to generate revenue, representing the cost of doing business. Excludes cost incurred in acquisition of income generating assets.
Value of output represents the sum of the sale of products and by-products, income from industrial services done for others, sale of goods less cost of goods sold, fixed assets produced on own account, and change in inventories of finished products and work-in-progress.
Intermediate expense refers to expenses incurred in the production of goods and industrial services such as raw materials used; other materials and supplies used; fuels, lubricants, oils and greases used; electricity and water purchased and industrial services done by others.
Value added is gross output less intermediate input. Gross output for the manufacturing sector is value of output plus income from non-industrial services done for others (except rent income from land). Intermediate input is intermediate expense plus expense for non-industrial services done by others (except rent expense for land) and all other cost.
Gross addition to tangible fixed assets is equal to capital expenditures less sale of fixed assets, including land.
Change in total inventories is computed as the total value of ending inventory less the total beginning inventory.
Subsidies are all special grants in the form of financial assistance or tax exemption or tax privilege given by the government to aid and develop an industry.
E-Commerce refers to the selling of products or services over electronic systems such as the Internet Protocol-based networks and other computer networks, Electronic Data Interchange (EDI) network, or other on-line system.
See more at the Annual Survey of Philippine Business Industry landing page.
| Attachment | Size |
|---|---|
|
|
85.71 KB |
|
|
65.03 KB |