
Wholesale and retail trade leads in terms of number of establishments
Based from the preliminary results of the 2015 Annual Survey of Philippine Business and Industry (ASPBI), total number of establishments with Total Employment (TE) of 20 and over in the formal sector of the economy was recorded at 34,740 compared to 35,009 in 2014. Of the 18 sectors, as shown in Figure 1, almost one in every four establishments was engaged in Wholesale and Retail Trade; Repair of Motor Vehicles and Motorcycles with 8,332 (24.0%) of the total. Manufacturing with 6,347 accounted for 18.3 percent of the total number of establishments in 2015. This was followed by Accommodation and Food Service Activities, and Education with 5,492 (15.8%) and 3,568 (10.3%), respectively. These top four sectors comprised 68.3 percent of the total establishments in 2015. On the other hand, Mining and Quarrying with 134 establishments, numbered the least with 0.4 percent share to the total count.


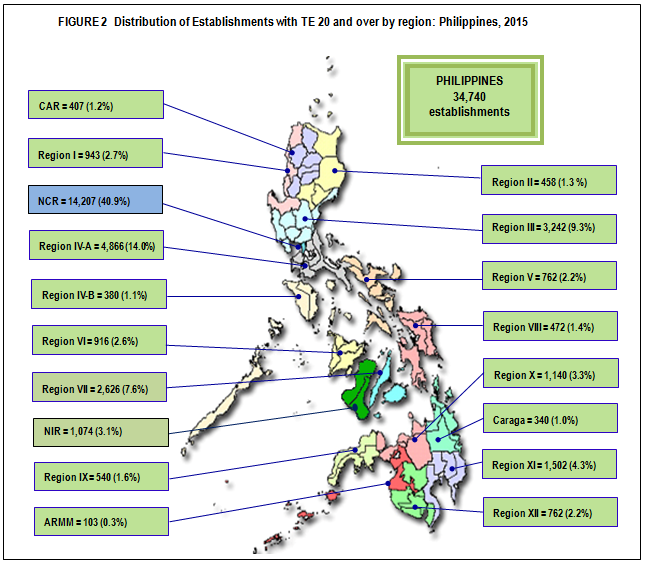
Across regions, 40.9 percent of establishments in 2015 were located in the National Capital Region (NCR) with a total of 14,207 establishments. CALABARZON with 4,866 establishments or 14.0 percent share ranked second. Central Luzon with 3,242 establishments (9.3%) and Central Visayas with 2,626 establishments (7.6%) placed third and fourth, respectively. Autonomous Region in Muslim Mindanao recorded the least count numbering to only 103 establishments or 0.3 percent share to total. Figure 2 shows the distribution of establishments by region across the country.
One in four workers is engage in Manufacturing; NCR reports highest number of workers
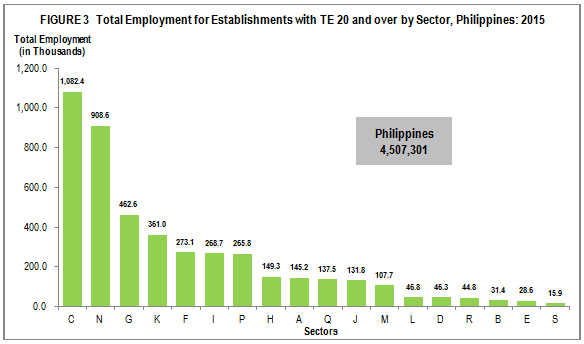
Total employment grew in 2015 by 9.2 percent to 4,507,301 from 4,127,623 workers in 2014. Manufacturing recorded the highest number of workers at 1,082,380, accounting for 24.0 percent of the total employment. Ranking second was Administrative and Support Service Activities with 908,643 workers or 20.2 percent share to total employment. Wholesale and Retail Trade, Repair of Motor Vehicles and Motorcycles ranked third with 462,553 workers or 10.3 percent share to total. Other Service Activities recorded the least share in number of workers with 15,864 workers or a mere 0.4 percent of the total employment (Figure 3).
Of the 18 regions nationwide, NCR, where most of the establishments are located, recorded the highest employment with 2,120,003 comprising 47.0 percent of the total. CALABARZON (723,580 workers or 16.1%) and Central Visayas (377,495 workers or 8.4%) settled for second and third posts, while ARMM contributed the least share (0.2%) with only 9,713 workers.
Total Compensation in 2015 reaches 1.3 trillion pesos
Total compensation paid to employees comprising of payment for gross salaries and wages of employees and other benefits paid by the establishment amounted to PHP1.3 trillion pesos, up by 14.2 percent from PHP1.2 trillion pesos recorded in 2014.
Manufacturing contributed almost one-fourth (22.9%) of the total compensation paid in 2015 at PHP304.4 billion in total. This was followed by Administrative and Support Service Activities and Financial and Insurance Activities paying PHP247.5 billion (18.6%) and PHP167.1 billion (12.6%) worth of compensation, respectively. Other Service Activities with PHP2.5 billion or 0.2 percent paid the least compensation to its employees.
By region, 60.5 percent of the total compensation in 2015 was contributed by NCR with PHP804.9 billion. CALABARZON was a far second with PHP191.0 billion or 14.3 percent of the total. Central Visayas (6.6%), Central Luzon (5.6%) and Davao Region (2.4%) completed the top five highest paying regions. ARMM paid the least compensation with PHP1.3 billion or 0.1 percent.
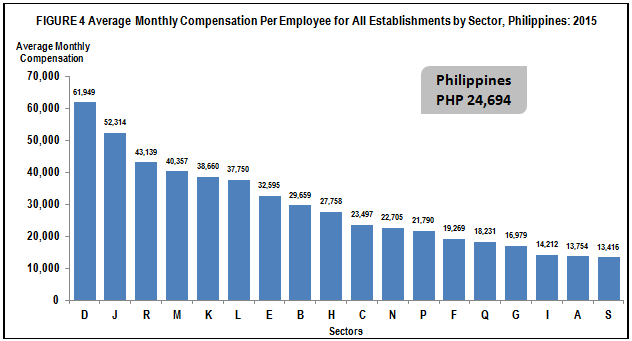
Average monthly compensation per employee in 2015 was estimated at PHP24,694. This represents an increase of 4.3 percent compared with the PHP23,665 average monthly compensation in 2014. Employees in Electricity, Gas, Steam and Air-Conditioning Supply sector received the highest average monthly pay of PHP61,949 in 2015, followed by employees in Information and Communication and Arts, Entertainment and Recreation with average monthly compensation of PHP52,314 and PHP43,139, respectively. Among the 18 sectors, Arts, Entertainment and Recreation posted highest increase in average monthly compensation with 32.1 percent to PHP43,139 in 2015 from PHP32,663 in 2014 (Figure 4).
By region, employees in NCR received the highest average monthly pay of PHP31,695. Employees in CALABARZON, were the second highest paid receiving an average monthly compensation of PHP22,063. The third highest earner were employees in Cordillera Administrative Region with PHP21,628 monthly compensation.
Manufacturing sector emerges as top income earner in 2015; NCR tops in Regions
Total income earned by establishments in 2015 amounted to PHP12.7 trillion, higher by PHP723.6 billion or an improvement of 6.1 percent from the PHP12.0 trillion earned in 2014.
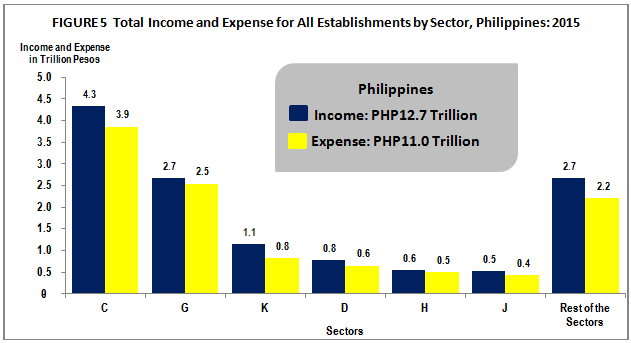
Manufacturing, the top income generator, accounted for 34.2 percent of total income at PHP4.3 trillion. Wholesale and Retail Trade, Repair of Motor Vehicles and Motorcycles ranked second, earning PHP2.7 trillion or 21.0 percent share to total, followed by Financial and Insurance Activities with PHP1.1 trillion (9.0%). Water Supply, Sewerage, Waste Management and Remediation Activities; and Other Service Activities contributed less than one percent share each to total income in 2015 with 0.7 percent and 0.1 percent, respectively (Figure 5).
Region wise, the top five regions in 2014 maintained their rankings in 2015. NCR which produced the highest income of PHP6.3 trillion accounted for 49.7 percent of the total income. CALABARZON with an income of PHP2.5 trillion contributed almost one-fifth (19.7%) to total, followed by Central Luzon with PHP1.2 trillion (9.3%), Central Visayas with PHP0.7 trillion (5.4%) and Davao Region with PHP0.3 trillion (2.6%). On the other hand, ARMM with PHP8.6 billion (0.1%) recorded the least share to total income.
Manufacturing; NCR incurs highest expense in 2015
Total expense incurred in business operations of establishments with TE of 20 and over amounted to PHP11.0 trillion in 2015, reflecting 6.6 percent increase from the PHP10.3 trillion spent in 2014.
Manufacturing, the highest spender, incurred PHP3.9 trillion or more than one-third (35.1%) of the total expense. Wholesale and Retail Trade; Repair of Motor Vehicles and Motorcycles ranked second with PHP2.5 trillion or 23.1 percent of the total, distantly followed by Financial and Insurance Activities spending PHP0.8 trillion (7.4%). Other Service Activities spent the least with PHP10.0 billion or 0.1 percent of the total (Figure 5).
Among regions, NCR spent the most amounting to PHP5.4 trillion or 49.1 percent of the total. This was followed by CALABARZON and Central Luzon spending PHP2.2 trillion (19.8%) and PHP1.1 trillion (9.6%), respectively. ARMM expended the least at PHP8.6 billion (0.1%).
Value Added amounts to PHP3.8 trillion
Value added generated by establishments with TE of 20 and over in 2015 stood at PHP3.8 trillion, higher by 11.4 percent from PHP3.4 trillion in 2014.
Manufacturing generated PHP1.1 trillion or 28.6 percent share to total, the highest among the sectors. Financial and Insurance Activities ranked second, generating PHP0.6 trillion or 15.0 percent of the total value added. This was followed by Administrative and Support Service Activities with PHP0.3 billion (8.3%), while Agriculture, Forestry and Fishing; and Other Service Activities contributed less than one percent (0.9%) and (0.2%) respectively, share to total value added.
At the regional level, NCR generated PHP2.2 trillion or more than half (56.9%) of the total value added, thrice more than that of CALABARZON which place second with PHP0.6 trillion (16.3%) worth of value added. ARMM trailed behind, contributing 0.05 percent share to total value added.
Workers of Electricity, Gas, Steam and Air-Conditioning Supply most productive
The ratio of value added to employment, a measure of simple labor productivity, was estimated at PHP841,792 in 2015, a slight increase of 2.1 percent compared to PHP824,810 in 2014.
Electricity, Gas, Steam and Air-Conditioning Supply remained to be the most productive sector in 2015, with value added per worker of almost PHP4.4 million. Real Estate Activities was the second most productive sector, generating PHP4.0 million value added per worker, followed by Mining and Quarrying with value added per worker of PHP2.6 million.
Other sectors with a million mark labor productivity were:
Information and Communication, PHP1.6 million
Financial and Insurance Activities, PHP1.6 million
Water Supply; Sewerage, Waste Management and Remediation Activities, PHP1.6 million
Arts, Entertainment and Recreation, PHP1.5 million
Transportation and Storage, PHP1.2 million
Professional, Scientific and Technical Activities, PHP1.0 million
Manufacturing, PHP1.0 million
By region, MIMAROPA posted the highest labor productivity at PHP1.8 million. This was distantly followed by NCR with labor productivity estimated at PHP1.0 million. Other regions that exceeded the national average were CAR and CALABARZON with value added per worker PHP0.9 million each.
Subsidies received from the government up by 44.3 percent
Total subsidies received by establishments with TE of 20 and over amounted to PHP56.6 billion in 2015, increased by 44.3 percent compared with PHP39.2 billion granted in 2014.
Financial and Insurance Activities received most of the subsidies in 2015 valued at PHP24.1 billion or 42.6 percent of the total. Electricity, Gas, Steam and Air Conditioning Supply received the second biggest amount of subsidy at PHP10.9 billion (19.2%), while Transportation and Storage received PHP9.3 billion (16.4%) came in third.
Other sectors that received more than a billion worth of subsidies from the government were:
Wholesale and Retail Trade; Repair of Motor Vehicles and Motorcycles, PHP3.3 billion
Agriculture, Forestry and Fishing, PHP3.1 billion
Manufacturing, PHP1.9 billion
Education, PHP1.4 billion
Administrative and Support Service Activities, PHP1.2 billion
At the regional level, Davao received the highest amount of subsidy in 2015 at PHP22.5 billion or 39.7 percent of the total. NCR, the highest recipient last year placed second with PHP20.1 billion (35.6%). Placing third is Caraga with PHP2.7 billion (4.8%).
Other regions that received more than a billion worth of subsidies from the government were:
Western Visayas, PHP1.4 billion
Central Visayas, PHP1.3 billion
Central Luzon, PHP1.1 billion
Bicol Region at PHP1.1 billion
E–commerce sales accounts for 0.3 percent of total income
Sales from e-commerce transactions in 2015 was estimated at PHP42.7 billion, lower by 4.3 percent compared with the PHP44.6 billion recorded in 2014.
Among the 18 sectors, Transportation and Storage recorded the largest sales through e-commerce transactions amounting to PHP31.0 billion or 72.5 percent of the total e-commerce sales and represented 5.6 percent of the total income of the sector. Accommodation and Food Service Activities followed with PHP5.0 billion sales from e-commerce or 11.4 percent share to total and accounted for 1.5 percent of the sector’s total income. Wholesale and Retail Trade; Repair of Motor Vehicles and Motorcycles came in third at PHP4.6 billion or 10.8 percent share to total sales from e-commerce in 2015 and accounted for 0.2 percent of the sector’s total income.
The following sectors did not report any e-commerce sales in 2015:
Agriculture, Forestry and Fishing
Mining and Quarrying
Electricity, Gas, Steam and Air Conditioning Supply
Water Supply; Sewerage, Waste Management and Remediation Activities
Construction
Real Estate Activities
Professional, Scientific and Technical Activities
Human Health and Social Work Activities
Other Service Activities
Among regions, NCR the only region that posted billion marks in e-commerce sales with PHP40.7 billion or 95.0 percent share to total, representing 0.6 percent of the total income of the region. Conversely, no sales from e-commerce transactions were reported for Cagayan Valley, Zamboanga Peninsula, CARAGA and ARMM.
TECHNICAL NOTES
Introduction
This Special Release presents the preliminary results of the 2015 Annual Survey of Philippine Business and Industry (ASPBI) for the ECONOMY WIDE (18 sectors) for establishments with total employment (TE) of 20 and over.
The 2015 ASPBI is one of the designated statistical activities of the Philippine Statistics Authority (PSA). Data collected from the survey provide information on the levels, structure, performance and trends of economic activities of the formal sector in the entire country for the year 2015. The 2015 Survey on Information and Communication Technology (SICT) was undertaken as a rider to this survey.
The survey was conducted nationwide in 2016 with the year 2015 as the reference period of data, except for employment which is as of November 15, 2015.
The Establishment Data Management System (EDMS) was utilized in the decentralized processing of 2015 ASPBI questionnaires in the province, as well as in the online accomplishment of questionnaire through the PSA website.
Data are presented at the national level by sector based on the 2009 Philippine Standard Industrial Classification (PSIC) and at the regional level.
Legal Authority
The conduct of 2015 ASPBI is authorized under Republic Act (RA) 10625 known as the Philippine Statistical Act of 2013 – Reorganizing and Strengthening of the Philippine Statistical System (PSS), its agencies and instrumentalities.
Scope and Coverage
The 2015 ASPBI covered establishments engaged in 18 economic sectors classified under the 2009 PSIC, namely:
Agriculture, Forestry, and Fishing (A)
Mining and Quarrying (B)
Manufacturing (C)
Electricity, Gas, Steam, and Air Conditioning Supply (D)
Water Supply; Sewerage, Waste Management and Remediation Activities (E)
Construction (F)
Wholesale and Retail Trade; Repair of Motor Vehicles and Motorcycles (G)
Transportation and Storage (H)
Accommodation and Food Service Activities (I)
Information and Communication (J)
Financial and Insurance Activities (K)
Real Estate Activities (L)
Professional, Scientific and Technical Activities (M)
Administrative and Support Service Activities (N)
Education (P)
Human Health and Social Work Activities (Q)
Arts, Entertainment, and Recreation (R)
Other Service Activities (S)
However, three (3) sectors of the 2009 PSIC are not covered. These are:
Public Administration and Defense; Compulsory Social Security (O)
Activities of Household as Employee. Undifferentiated Goods and Services Producing Activities of Household for Own Use (T)
Activities of Extraterritorial Organizational Bodies (U)
The survey was confined to the formal sector of the economy, which consists of the following:
Corporations and partnership
Cooperatives and foundations
Single proprietorship with employment of 10 and over
Single proprietorships with branches
Thus, the 2015 ASPBI covered only the following economic units:
All establishments with total employment (TE) of 10 and over, and
All establishments with TE of less than 10, except those establishments with Legal Organization = 1 (single proprietorship) and Economic Organization = 1 (single establishment), that are engaged in economic activities classified according to the 2009 PSIC.
Frame of Establishments
The frame for the 2015 ASPBI was extracted from the 2015 List of Establishments (LE). The estimated number of establishments in operation in the country in 2015 totaled to 909,786. About 259,386 establishments (29.0% of the total establishments) belong to the formal sector of which 223,821 (86.3%) comprised the establishment frame. This frame was used to draw the sample establishments for the survey.
Unit of Enumeration
The unit of enumeration for the 2015 ASPBI is the establishment. An establishment is defined in the United Nations International Recommendations on Industrial Statistics as an economic unit, which engages, under a single ownership or control, i.e. under a single legal entity, in one or predominantly one kind of economic activity at a single fixed physical location.
Classification of Establishments
An establishment is categorized by its economic organization, legal organization, industrial classification, employment size, and geographic location.
Economic Organization relates to the organizational structure or role of the establishment in the organization. An establishment may be single establishment, branch, establishment and main office with branches elsewhere, main office only, and ancillary unit other than main office.
Legal Organization refers to the legal form of the economic entity that owns the establishment. This provides the legal basis for ownership. An establishment may be single proprietorship, partnership, government corporation, stock corporation, non-stock corporation, and cooperative.
Industrial classification of an economic unit was determined by the activity from which it derives its major income or revenue. The 2009 PSIC was utilized to classify economic units according to their economic activities.
Size of an establishment is determined by its TE as of a specific date.
Geographic Classification refers to the classification of establishments by geographic area using the Philippine Standard Geographic Code (PSGC) classification.
Methodology
Sampling Design
The 2015 ASPBI utilized stratified systematic sampling with 5-digit PSIC serving as the industry strata and employment size as the second stratification variable.
For establishments with TE of 20 and over, the 18 administrative regions serve as the geographic domains while the 5-digit level (sub-class) of the 2009 PSIC serves as the industry domain.
Estimation Procedure
For Establishments with TE of 20 and Over
- Non-Certainty Stratum (strata of TE 20 to 49 and TE 50 to 99)
The estimate of the total of a characteristic ![]() for the non-certainty employment strata in an industry domain in each region,
for the non-certainty employment strata in an industry domain in each region,
where:
s = denotes the non-certainty employment strata in TE of 20 to 99
p = 1, 2…18 regions (geographic domains)
xspj = value of the jth establishment in the non-certainty employment strata in TE of 20 to 99 for an industry domain in each region
j = 1, 2, 3…nsp establishments
Wspj = weight of the jth establishment in the non-certainty employment strata in TE of 20 to 99 for an industry domain in each region
Nsp = total number of establishments in the non-certainty employment strata in TE of 20 to 99 for an industry domain in each region
nsp = number of sample establishments in the non-certainty employment strata in TE of 20 to 99 for an industry domain in each region
- Certainty Stratum (TE 100 and over)
The value of the total of a characteristic ![]() for the certainty employment stratum in an industry domain in each region,
for the certainty employment stratum in an industry domain in each region,

where:
c = denotes the certainty employment strata in TE 100 and over
p = 1, 2…17 regions (geographic domains)
xcpj = value of the jth establishment in the certainty employment strata in TE 100 and over in an industry domain within each region
j = 1, 2, 3…mcp establishments
mcp = number of establishments in the certainty employment strata in TE 100 and over in an industry domain within each region
- Total Estimate for TE of 20 and Over
The estimate of the total of a characteristic ![]() for the industry domain in each region (geographic domain) was obtained by aggregating the estimates for all employment strata (non-certainty and certainty) in the same industry domain,
for the industry domain in each region (geographic domain) was obtained by aggregating the estimates for all employment strata (non-certainty and certainty) in the same industry domain,
Where dp denotes the industry domains in each region.
National level estimates of the characteristics by industry domain were obtained by aggregating separately the estimates ![]() for the particular industry domain from all the regions.
for the particular industry domain from all the regions.
For Establishments with TE of Less Than 20
Non-Certainty Stratum
The estimate of the total of a characteristic ( ![]() ) for the non-certainty employment stratum TE less than 20 in the sth industry domain was
) for the non-certainty employment stratum TE less than 20 in the sth industry domain was

where:
s = denotes the non-certainty employment strata in TE of less than 20
Xsj = value of the jth establishment in non-certainty employment stratum in TE of less than 20 in Sth industry domain
j = 1, 2, 3…ns establishments
Wsj = weight of the jth establishment in the non-certainty employment stratum of less than 20 in the sth industry domain
Ns = total number of establishments in the non-certainty employment stratum in TE of less than 20 in the sth industry domain
ns = number of sample establishments in the non-certainty employment stratum in TE of less than 20 in sth domain
Weight Adjustment Factor for Non-Response
To account for non-response in the non-certainty strata, the adjustment factor (n/n’) was multiplied with the sampling weight (W) of each of the sampling unit. The sampling weight, defined as N/n, was recomputed as
Thus, the adjusted weight (W’sj) for employment stratum in TE 1-9 or TE 10-19 was
where:
Ns = total number of establishments in the employment stratum in TE 1-9 or TE 10-19 in the sth industry domain
n's = number of responding establishments in the employment stratum in TE 1-9 or TE 10-19 in the sth industry domain
For the non-certainty employment stratum for the selected industry domain with TE 20-99, the adjusted weight (W'spj) was
where:
Nsp = total number of establishments in the non-certainty employment stratum with TE 20-99 for the selected industry domain within each geographic domain (region)
n'sp = number of responding establishments in the non-certainty employment stratum with TE 20-99 for the selected industry domain within each geographic domain (region)
Questionnaire Design
There are seven types of questionnaires used for the survey which will capture data for establishments of the 18 sectors of economy as defined in the 2009 PSIC. A clearance number and expiry date is shown at the upper right hand corner of the cover page of the questionnaire. The questionnaire is administered to the sample establishment through the establishment itself or a reporting unit. An address stub which contains information on the business name and complete address of the sample establishment is pasted in every questionnaire to guide the field staff on where to deliver the questionnaire.
A web-based version of the 2015 ASPBI questionnaires was available for accomplishment by sample establishment online at the PSA website, https://aspbi.psa.gov.ph.
Response Rate
The response rate for establishments with TE of 20 and over was 93.21 percent (18,512 out of 19,861 establishments). Included are receipts of "good" questionnaires, partially accomplished questionnaires, reports of closed, moved out or out of scope establishments, etc.
Reports of the remaining non-reporting establishments were imputed based on established imputation methods and from other available administrative data sources. However, reports of establishments in the certainty stratum, which were found to be duplicates and out of business in 2015, were not imputed. The table below shows the response rate by sector and the number of establishments which responded on-line.
TABLE 1 2015 ASPBI Response Rates for Establishments with TE of 20 and over
2009 PSIC | Industry Description | Number of Samples | Number of Responding Establishment | Response Rate (%) | Number of Responding Establishment On-line |
|---|---|---|---|---|---|
Philippines | 19,861 | 18,512 | 93.21 | 577 | |
A | Agriculture, Forestry and Fishing | 767 | 728 | 94.92 | 15 |
B | Mining and Quarrying | 161 | 130 | 80.75 | 0 |
C | Manufacturing | 4,926 | 4,511 | 91.58 | 165 |
D | Electricity, Gas, Steam and Air-Conditioning Supply | 237 | 214 | 90.30 | 0 |
E | Water Supply; Sewerage, Waste Management and Remediation Activities | 338 | 303 | 89.64 | 19 |
F | Construction | 740 | 661 | 89.32 | 25 |
G | Wholesale and Retail Trade; Repair of Motor Vehicles and Motorcycles | 4,311 | 4,022 | 93.30 | 31 |
H | Transportation and Storage | 980 | 921 | 93.98 | 19 |
I | Accommodation and Food Service Activities | 992 | 926 | 93.35 | 13 |
J | Information and Communication | 974 | 905 | 92.92 | 33 |
K | Financial and Insurance Activities | 1,024 | 1,011 | 98.73 | 71 |
L | Real Estates Activities | 260 | 244 | 93.85 | 14 |
M | Professional, Scientific and Technical Activities | 430 | 381 | 88.60 | 31 |
N | Administrative and Support Service Activities | 1,623 | 1,526 | 94.02 | 51 |
P | Education | 1,060 | 1,058 | 99.62 | 54 |
Q | Human Health and Social Work Activities | 580 | 538 | 92.76 | 25 |
R | Arts, Entertainment and Recreation | 229 | 220 | 96.07 | 5 |
S | Other Service Activities | 227 | 213 | 93.83 | 6 |
Limitation of Data
The 2015 ASPBI covered only the formal sector of the economy.
Concepts and Definitions of Terms
Economic activity is the establishment’s source of income. If the establishment is engaged in several activities, its main economic activity is that which earns the biggest income or revenue.
Total employment is the number of persons who worked in for the establishment as of November 15, 2015.
Paid employees are all persons working in the establishment and receiving pay, as well as those working away from the establishment paid by and under the control of the establishment. Included are all employees on sick leave, paid vacation or holiday. Excluded are consultants, home workers, receiving pure commissions only, and workers on indefinite leave.
Compensation is the sum of salaries and wages, separation/retirement/terminal pay, gratuities, and payments made by the employer in behalf of the employees such as contribution to SSS/GSIS, ECC, PhilHealth, Pag-ibig, etc.
Salaries and wages are payments in cash or in kind to all employees, prior to deductions for employee’s contributions to SSS/GSIS, withholding tax, etc. Included are total basic pay, overtime pay and other benefits.
Income or Revenue refers to cash received and receivables for goods/products and by-products sold and services rendered.
E-commerce refers to the selling of products or services over electronic systems such as Internet Protocol-based networks and other computer networks. Electronic Data Interchange (EDI) network, or other on-line system. Excluded are orders received from telephone, facsimile and e-mails.
Cost refers to all expenses incurred during the year whether paid or payable. Valuation is at purchaser prices including taxes and other charges, net of rebates, returns and allowances. Goods and services received by the establishment from other establishments of the same enterprise are valued as though purchased.
Expense refers to cost incurred by the establishment during the year whether paid or payable. This is treated on a consumed basis.
Intermediate expense (for industrial sectors A, B, D, E F) are expenditures incurred in the production of goods such as materials and supplies purchased, fuels purchased, electricity and water purchased, and industrial services done by others plus beginning inventory of materials, supplies and fuels less ending inventory of materials, supplies and fuels.
Value added is gross output less intermediate input. Gross output is value of output plus income from non-industrial services done for others (except rent income from land). Intermediate input is intermediate expense plus expense for non-industrial services done by others (except rent expense for land) and other costs.
Value of output (for industrial sectors A, B, D, E F) represents the sum of the receipts from products and by-products sold, income from industrial services done for others, and goods sold in the same condition as purchased less the cost of goods sold; and value of fixed assets produced on own account, and change in inventories of finished products and work-in-progress.
Gross addition to tangible fixed assets is equal to capital expenditures less sale of fixed assets, including land.
Inventories refer to the stock of goods owned by and under the control of the establishment as of a fixed date, regardless of where the stocks are located. Valuation is at current replacement cost in purchaser prices. Replacement cost is the cost of an item in terms of its present price rather than its original cost.
Change in inventories is equivalent to the value of inventories at the end of the year less the value of inventories at the beginning of the year.
Subsidies are all special grants in the form of financial assistance or tax exemption or tax privilege given by the government to aid and develop an industry.
ROMEO S. RECIDE
Assistant Secretary
Deputy National Statistician
Sectoral Statictics Office