
Construction of buildings industry dominates the sector in terms of number of establishments
The preliminary results of the 2015 Annual Survey of Philippine Business and Industry (ASPBI) showed that there were 1,121 establishments with total employment (TE) of 20 and over engaged in construction in the formal sector of the economy.
Construction of buildings recorded the most number of establishments with 407 accounting for 36.3 percent of the total. This was followed by construction of roads and railways with 291 establishments or 26.0 percent share to total. Electrical, plumbing and other construction installation activities came in third with 230 establishments or 20.5 percent of the total. On the other hand, demolition and site preparation recorded the least number with only four establishments or 0.4 percent of the total.
Figure 1 shows the distribution of construction establishments with TE of 20 and over by industry group in 2015.

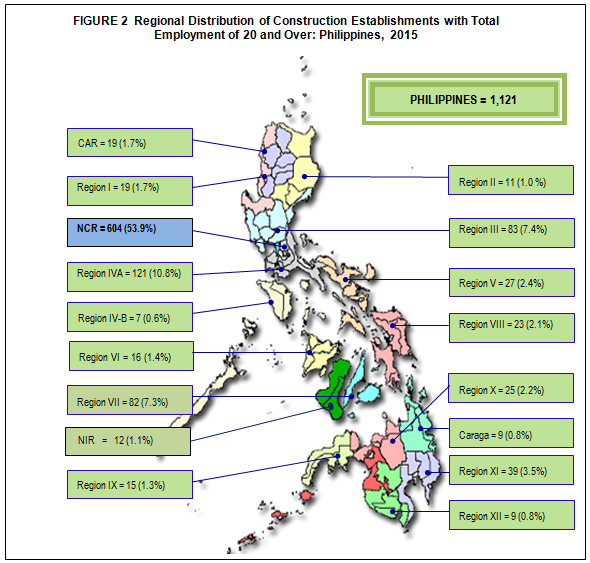
National Capital Region (NCR) with 604 establishments or 53.9 percent of the total, led the regions in terms of the number of establishments. CALABARZON ranked second with 121 or 10.8 percent of the total. MIMAMOPA recorded the least count with only 7 establishments or 0.6 percent of the total. Meanwhile, no construction establishment was recorded in Autonomous Region of Muslim Mindanao (ARMM) in 2015.
Figure 2 shows the regional distribution of construction establishments with TE of 20 and over in 2015.
Construction of buildings industry generates the highest employment
Construction establishments with TE of 20 and over employed a total of 273,111 workers in 2015. Of the total employment, 99.8 percent are paid employees and the rest are working owners and unpaid workers.
Construction of buildings with 97,776 workers (35.8%) reported the highest number of workers. This was followed by construction of roads and railways with 94,959 workers (34.8%). Electrical, plumbing and other construction installation activities with 35,974 workers (13.2%) placed third.
Figure 3 shows the distribution of employment for construction establishments with TE of 20 and over by industry group in 2015.

NCR, having the most number of establishments, employed the bulk of the workers numbering to 193,934 or 71.0 percent of the total. Central Visayas with 18,572 (6.8%) workers followed distantly. Completing the top three regions with the most number of workers was Central Luzon with 16,845 workers (6.2%).
The average number of workers per establishment was recorded at 244 for the sector. Construction of other civil engineering projects reported the highest with 396 workers per establishment, followed by construction of roads and railways and demolition and site preparation with 326 and 270 workers per establishment respectively.
Construction of other civil engineering projects industry pays the highest average annual compensation
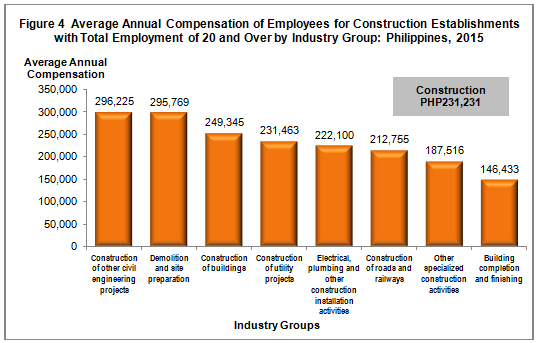
Total compensation paid in 2015 by construction establishments with TE 20 and over amounted to PHP63.0 billion, indicating an average annual compensation of PHP231,231 per employee.
Construction of other civil engineering projects paid the highest average annual compensation amounting to PHP296,225 per employee. This was followed by demolition and site preparation with employees receiving an average annual pay of PHP295,769. Construction of buildings placed third at PHP249,345 per employee.
Figure 4 displays the average annual compensation of employees for construction establishments with TE of 20 and over by industry group in 2015.
At the regional level, five regions reported an average annual compensation higher than the national average in 2015. These were
Bicol, PHP641,719
Zamboanga Peninsula, PHP413,006
SOCCSKSARGEN, PHP360,332
Davao, PHP251,790
NCR, PHP250,847
Value of output of the sector reaches PHP375.3 billion
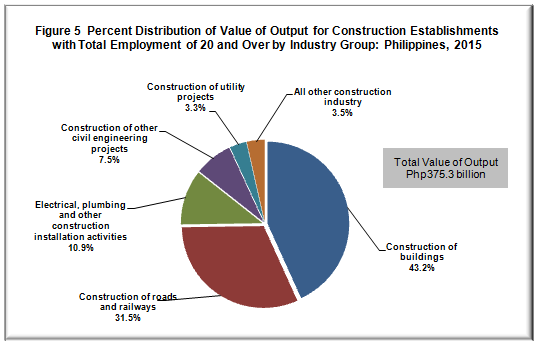
Total value of output generated by construction establishments with TE of 20 and over amounted to PHP375.3 billion in 2015.
By industry, value of output generated by construction of buildings accounted for more than two fifths, worth PHP162.3 billion or 43.2 percent of the total. This was followed by construction of roads and railways with an output share of PHP118.3 billion or 31.5 percent of the total. Placing third was electrical, plumbing and other construction installation activities with PHP40.8 billion or 10.9 percent. The shares of other industries to the total value of output are as follows:
Construction of other civil engineering projects, PHP28.1 billion (7.5%)
Construction of utility projects, PHP12.5 billion (3.3%)
All other construction industries, PHP13.2 billion (3.5%)
Figure 5 shows the distribution of value of output for construction establishments with TE of 20 and over by industry group in 2015.
Among regions, NCR shared the biggest output value amounting to PHP275.1 billion, comprising 73.3 percent of the total value of output. This was followed by Central Visayas and CALABARZON with respective output value and shares of PHP19.7 billion, 5.2 percent and PHP16.2 billion, 4.3 percent.
Total expense amounts to PHP346.8 billion, construction of buildings industry spends the most
Total expense, including compensation, for construction with TE of 20 and over amounted to PHP346.8 billion in 2015.
Among industries, construction of buildings incurred the highest expense amounting to PHP144.6 billion or 41.7 percent of the total. Construction of roads and railways placed second with PHP110.5 billion or 31.8 percent. Electrical, plumbing and other construction installation activities came in next with a total expense of PHP39.0 billion or 11.3 percent.
In 2015, NCR was the highest spender among regions estimated at PHP257.8 billion (74.3%). This was followed by Central Visayas and CALABARZON spending PHP17.0 billion (4.9%) and PHP14.7 billion (4.2%), respectively.
Construction of buildings industry records the highest return
Income per expense ratio for construction establishments with TE of 20 and over in 2015 was recorded at 1.12, indicating that for every peso spent PHP1.12 was realized in terms of income.
Among industries, construction of buildings registered the highest income per expense ratio of 1.15, followed by building completion and finishing, and construction of roads and railways with 1.11 income per expense ratio each. Demolition and site preparation, electrical, plumbing and other construction installation activities, and construction of utility projects all registered 1.07 income per expense ratio. On the other hand, construction of other civil engineering projects, and other specialized construction activities recorded an income per expense ratio of 1.06 each.
Among regions, MIMAROPA recorded the highest return at 2.03 income per expense ratio. Caraga followed next at 1.67 and Eastern Visayas at 1.41 income per peso expense.
Value added reaches PHP145.4 billion
Value added generated by construction establishments with TE of 20 and over reached PHP145.4 billion in 2015.
Construction of buildings recorded as the top contributors to value added with PHP61.9 billion or 42.5 percent of the total. This was followed by construction of roads and railways with PHP49.9 billion or 34.3 percent and electrical, plumbing and other construction installation activities with PHP12.5 billion or 8.6 percent.
By region, NCR contributed the biggest share with PHP106.9 billion or 73.5 percent of the total value added. This was followed by Central Visayas and Central Luzon with respective value added and shares of PHP7.4 billion or 5.1 percent and PHP 6.2 billion or 4.3 percent.
Labor productivity of the sector registers PHP532.5 thousand per worker
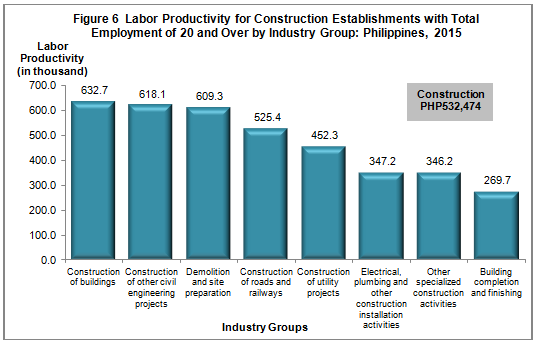
The ratio of value added per worker, a measure of simple labor productivity, was estimated at PHP532.5 thousand per worker in 2015.
Construction of buildings generated the highest labor productivity of PHP632.7 thousand per worker, among industries. Construction of other civil engineering projects followed with PHP618.1 thousand per worker. Demolition and site preparation came in third with PHP609.4 thousand per worker. Labor productivity of other construction industry groups are as follows:
Construction of roads and railways, PHP525.4 thousand per worker
Construction of utility projects, PHP452.3 thousand per worker
Electrical, plumbing and other construction installation activities, PHP347.2 thousand per worker
Other specialized construction activities, PHP346.2 thousand per worker
Building completion and finishing, PHP269.7 thousand per worker
Figure 6 shows the labor productivity for construction establishments with TE of 20 and over by industry group in 2015.
Among regions, the most productive was MIMAROPA generating PHP2,094.1 thousand value added per worker. Caraga followed with PHP1,426.3 thousand value added per worker and Bicol placed third with PHP1,307.5 thousand value added per worker.
Construction of roads and railways posts the highest gross addition to tangible fixed assets
Gross addition to tangible fixed assets, (capital expenditures less sale of fixed assets, including land), acquired by the sector amounted to PHP9.0 billion in 2015 for establishments with TE of 20 and over.
Construction of roads and railways acquired PHP5.4 billion worth of gross addition to fixed assets or 60.4 percent of the total. Other construction industries gross addition to fixed assets are as follows:
Construction of buildings with PHP2.1 billion (23.4%)
Construction of other civil engineering projects with PHP0.6 billion (6.9%)
Electrical, plumbing and other construction installation activities with PHP0.4 billion (4.5%)
Other specialized construction activities with PHP0.2 billion (1.8%)
All other construction industry groups with PHP0.3 billion (2.9%)
Subsidies
There was no reported subsidy in 2015 for construction establishments with TE of 20 and over.
TECHNICAL NOTES
Introduction
This Special Release presents the preliminary results of the 2015 ASPBI for the Construction sector for establishments with total employment of 20 and over.
The 2015 ASPBI is one of the designated statistical activities of the Philippine Statistics Authority (PSA). Data collected from the survey provide information on the levels, structure, performance, and trends of economic activities of the formal sector in the entire country for the year 2015. The 2015 Survey on Information and Communication Technology (SICT) was undertaken as a rider to this survey.
The survey was conducted nationwide in 2016 with the year 2015 as the reference period of data, except for employment which is as of November 15, 2015.
Establishment Data Management System (EDMS) was still utilized in the decentralized processing of 2015 ASPBI questionnaires in the province as well as the online accomplishment of questionnaire through the PSA website.
Data are presented at the national and industry group or 3-digit 2009 Philippine Standard Industrial Classification (PSIC) and at the regional level.
Legal Authority
The conduct of the 2015 ASPBI is authorized under the following:
Republic Act 10625 known as the Philippine Statistical Act of 2013 – (Reorganizing and strengthening of the Philippine Statistical System (PSS), its agencies and instrumentalities). It shall be the policies of the State to effect the necessary and proper changes in the organizational and functional structures of the PSS in order to rationalize and promote efficiency and effectiveness in the delivery of statistical services.
Section 27 of Republic Act No. 10625 states that:
“… Respondents of primary data collection activities such as censuses and sample surveys are obliged to give truthful and complete answers to statistical inquiries. The gathering, consolidation and analysis of such data shall likewise be done in the most truthful and credible manner. Any violation of this Act shall result in the imposition of the penalty of one (1) year imprisonment and a fine of One hundred thousand pesos (P100,000.00). In cases where the respondent fails to give truthful and complete answers to such statistical inquiries is a corporation, the above penalty shall be imposed against the responsible officer, director, manager and/or agent of said corporation. In addition, such erring corporation, enterprise or business concerned, shall be imposed a fine ranging from One hundred pesos (P100,000.00) to Five hundred thousand pesos (P500,000.00)…”
Scope and Coverage
The 2015 ASPBI covered establishments engaged in 18 economic sectors classified under the 2009 PSIC, namely:
Agriculture, Forestry and Fishing (A)
Mining and Quarrying (B)
Manufacturing (C)
Electricity, Gas, Steam, and Air Conditioning Supply (D)
Water Supply; Sewerage, Waste Management and Remediation Activities (E)
Construction (F)
Wholesale and Retail Trade; Repair of Motor Vehicles and Motorcycles (G)
Transportation and Storage (H)
Accommodation and Food Service Activities (I)
Information and Communication (J)
Financial and Insurance Activities (K)
Real Estate Activities (L)
Professional, Scientific and Technical Activities (M)
Administrative and Support Service Activities (N)
Education (P)
Human Health and Social Activities (Q)
Arts, Entertainment and Recreation (R)
Other Service Activities (S)
However, three (3) sectors of the 2009 PSIC are not covered. These are:
Public Administration and Defense; Compulsory Social Security (Section O)
Activities of Households as Employers; Undifferentiated Goods and Services Producing Activities of Households for Own Use (Section T)
Activities of Extra-territorial Organization and Bodies (Section U)
The survey was confined to the formal sector of the economy, which consists of the following:
Corporations and partnership
Cooperatives and foundations
Single proprietorship with employment of 10 and over
Single proprietorships with branches
Hence, the 2015 ASPBI covered only the following economic units:
All establishments with total employment of 10 and over; and
All establishments with total employment of less than 10, except those with Legal Organization = 1 (Single proprietorship) and Economic Organization = 1 (Single establishments), that are engaged in economic activities described according to the 2009 Philippine Standard Industrial Classification (PSIC)
Frame
The frame for the 2015 ASPBI was extracted from the 2015 List of Establishments (LE). The estimated number of establishments in operation in the country in 2015 totaled to 909,786. About 259,386 establishments (29.0% of the total establishments) belong to the formal sector of which 223,821 (86.3%) comprised the establishment frame. This frame was used to draw the sample establishments for the survey.
Unit of Enumeration
The unit of enumeration for the 2015 ASPBI is the establishment. An establishment is defined as an economic unit under a single ownership or control which engages in one or predominantly one kind of activity at a single fixed location.
For the construction sector, the establishment is defined in operational terms to take into account the organization and record-keeping practices by making the single physical location and activity criteria more flexible, hence, the kind-of-activity unit (KAU) was used. KAU is ‘the unit that is engaged in the production of the most homogeneous group of goods and services, usually at one location, but sometimes over a wider area, for which separate records are available that can provide data concerning the production of these goods and services and the materials, labor and physical resources used in this production.”
Classification of Establishments
An establishment is categorized by its economic organization, legal organization, industrial classification, employment size, and geographic location.
Economic Organization relates to the organizational structure or role of the establishment in the organization. An establishment may be single establishment, branch, establishment and main office with branches elsewhere, main office only, and ancillary unit other than main office.
Legal Organization refers to the legal form of the economic entity that owns the establishment. This provides the legal basis for ownership. An establishment may be single proprietorship, partnership, government corporation, stock corporation, non-stock corporation, and cooperative.
Industrial classification of an economic unit was determined by the activity from which it derives its major income or revenue. The 2009 PSIC which was approved for adoption by government agencies and instrumentalities through NSCB Resolution No. 2 Series 2010 was utilized to classify economic units according to their economic activities.
Size of an establishment is determined by its total employment (TE) as of a specific date. Total employment (TE) refers to the total number of persons who work in or for the establishment.
This includes paid employees, working owners, unpaid workers and all employees who work full-time or part-time including seasonal workers. Included also are persons on short term leave such as those on sick, vacation or annual leaves and on strike.
Geographic Classification refers to the grouping or classification of establishments by geographic area using the Philippine Standard Geographic Code (PSGC) classification. The PSGC contains the latest updates on the official number of regions, provinces, cities, municipalities, and barangays in the Philippines. The PSGC as of December 31, 2015 was used for the 2015 ASPBI.
Methodology
Sampling Design
The survey utilized stratified systematic sampling with 3-digit or 5-digit PSIC serving as the industry strata and employment size as the second stratification variable.
For establishments with TE of 20 and over, the 18 administrative regions serve as the geographic domains while the 5-digit level (sub-class) of the 2009 PSIC serves as the industry domain.
Estimation Procedure for Establishments with TE of 20 and Over
a. Non-Certainty Stratum (strata of TE 20 to 49 and TE 50 to 99) for Sections A,C,E,F,G, H, I, J, K, L, M, N, P, Q, R and S.
The estimate of the total of a characteristic ![]() for the non-certainty employment strata in TE of 20 and over for an industry domain in each region
for the non-certainty employment strata in TE of 20 and over for an industry domain in each region
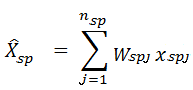
where:
s = denotes the non-certainty employment strata in TE of 20 and over
p = 1,2,...18 regions (geographic domains)
Xspj = value of the jthestablishment in the non-certainty employment strata in TE of 20 and over for an industry domain in each region
j = 1,2,3,..., nsp establishments
Wspj = weight of the jth establishment in non-certainty employment strata in TE of 20 and over for an industry domain in each region
Nsp = total number of establishments in the non-certainty employment strata in TE of 20 and over for an industry domain in each region
nsp = number of sample establishments in the non-certainty employment strata in TE of 20 and over for an industry domain in each region
b. Certainty Stratum (Establishments under the following: Section B and D, ICT core industries, BPM industries, GOCC's and with TE 100 and over)
The estimate of the total of a characteristic ![]() for the certainty employment stratum in an industry domain in each region
for the certainty employment stratum in an industry domain in each region
where:
c = denotes the certainty employment strata in TE of 20 and over
p = 1,2,...18 regions (geographic domains)
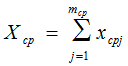
Xcpj = value of the jthestablishment in the non-certainty employment strata in TE of 20 and over for an industry domain in each region
j = 1,2,3,..., mcp establishments
mcp = number of establishments in the certainty employment strata in TE of 20 and over in an industry domain within each region
c. Total Estimate for TE of 20 and Over
The estimate of the total of a characteristic ![]() for the industry domain in each region (geopraphic domain) was obtained by aggregating the estimated for all employment strata (non-certainty and certainty) in the same industry domain,
for the industry domain in each region (geopraphic domain) was obtained by aggregating the estimated for all employment strata (non-certainty and certainty) in the same industry domain,
where dp denotes the industry domains in each region
National level estimate of the the characteristic by industry domain were obtained by aggregating separately the estimates ![]() for the particular industry domain from all the regions,
for the particular industry domain from all the regions,
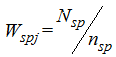
Weight Adjusment Factor for Non-Response
To account for non-response in the non-certainty strata, the adjusment factors, and (n/n') was multipled with the sampling weight (W) of each of the sampling unit. The sampling weight which is defined as N/n was recomputed as
Thus, the adjusted weight (W'spj) for the non-certainty employment stratum for the industry domain with TE 20-99 was
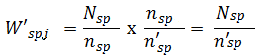
Where:
Nsp = total number of establishments in the non-certainty employment stratum with TE 20-99 for the industry domain within each geographic domain (region)
n'sp = number of responding establishments in the non-certainty employment stratum with TE of 20-99 for the industry domain within each geographic domain (region)
Response Rate
Response rate for Construction Sector for establishments with TE of 20 and over was 89.3 percent (661 out of 740 establishments). This included receipts of "good" questionnaires, partially accomplished questionnaires, reports of closed, moved out or out of scope establishments.
Reports of the remaining non-reporting establishments were imputed based on established imputation methods, other available administrative data sources and financial statements from Securities and Exchange Commission (SEC). However, reports of establishments which were found to be duplicates and out of business in 2015, were not imputed.
Limitation of Data
Only the formal sector was covered in the survey.
Concepts and Definitions of Terms
Economic Activity is the establishment’s source of income. If the establishment is engaged in several activities, its main economic activity is that which earns the biggest income or revenue.
Total employment is the number of persons who worked in for the establishment as of November 15, 2015.
Paid employees are all full-time and part-time employees working in or for the establishment and receiving pay, as well as those working away from the establishment and paid by and under the control of the establishment. Included also are all employees on sick or maternity leave, paid vacation or holiday and on strike. Excluded are directors paid solely for their attendance at meetings, consultants, workers on indefinite leave, working owners who do not receive regular pay, home workers and 98 workers receiving pure commissions only.
Compensation is the sum of salaries and wages, separation, terminal pay and gratuities paid by the establishment to its employees and total employer’s contribution to SSS/GSIS, ECC, PhilHealth, PAG-IBIG etc.
Salaries and wages are payments in cash or in kind to all employees, prior to deductions for employee’s contributions to SSS/GSIS, withholding tax, etc. Included are total basic pay, overtime pay and other benefits.
Income or Revenue includes cash received and receivables for goods/products and by-products sold and services rendered. Valuation is at producer prices (ex-establishment) net of discounts, and allowances, including duties and taxes but excluding subsidies.
E-Commerce refers to the selling of products or services over electronic systems such as the Internet Protocol-based networks and other computer networks, Electronic Data Interchange (EDI) network, or other on-line system. Excluded are orders received from telephone, facsimile and e-mails.
Cost refers to all expenses incurred during the year whether paid or payable. Valuation is at purchaser prices including taxes and other charges, net of rebates, returns and allowances. Goods and services received by the establishment from other establishments of the same enterprise are valued as though purchased.
Expense refers to cost incurred by the establishment in an enterprise’s effort to generate revenue, representing the cost of doing business. This is treated on a consumed basis. It excludes cost incurred in the acquisition of income generating assets.
Intermediate expense are expenditures incurred for construction activity such as construction materials and supplies purchased, fuels, lubricants, oils and greases purchased, electricity and water purchased, and contract and commission work done by others plus beginning inventory of construction materials, supplies, fuels, lubricants, oils and greases less ending inventory of materials, supplies, fuels, lubricants, oils and greases.
Value added is gross output less intermediate input. Gross output is value of output plus income from non-industrial services done for others (except rent income from land). Intermediate input is intermediate expense plus expense for non-industrial services done by others (except rent expense for land) and all other expense.
Value of output represents the sum of the receipts from domestic construction activities, net income earned from construction abroad, contract and commission work done for others, income from products manufactured and sold less cost of products sold, and goods sold in the same condition as purchased less the cost of goods sold; and value of tangible fixed assets produced on own account and change in inventories of finished products and work-in-progress.
Gross addition to tangible fixed assets is equal to capital expenditures less sale of fixed assets, including land.
Change in Inventories is computed as the value of ending inventory less the beginning inventory.
Inventories refer to the stock of goods owned by and under the control of the establishment as of a fixed date, regardless of where the stocks are located. Valuation is at current replacement cost in purchaser prices. Replacement cost is the cost of an item in terms of its present price rather than its original cost.
Subsidies refer to special grants received from the government in the form of financial assistance or tax exemption or tax privilege to aid and develop an industry.